
Page 258 - Ebook HTKH 2024
P. 258
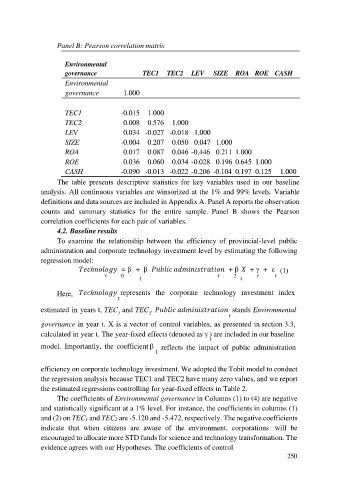
Panel B: Pearson correlation matrix


                        Environmental
                        governance                 TEC1  TEC2  LEV          SIZE  ROA  ROE  CASH
                        Environmental

                        governance          1.000

                        TEC1                -0.015  1.000
                        TEC2                0.008  0.576  1.000
                        LEV                 0.034  -0.027  -0.018  1.000
                        SIZE                -0.004  0.207  0.050  0.047  1.000
                        ROA                 0.017  0.087  0.046 -0.446  0.211  1.000

                        ROE                 0.036  0.060  0.034 -0.028  0.196  0.645  1.000
                        CASH                -0.090  -0.013  -0.022 -0.206  -0.104  0.197  0.125  1.000
                     The  table  presents  descriptive  statistics  for  key  variables  used  in  our  baseline
               analysis. All continuous variables are winsorized at the 1% and 99% levels. Variable
               definitions and data sources are included in Appendix A. Panel A reports the observation

               counts  and  summary  statistics  for  the  entire  sample.  Panel  B  shows  the  Pearson
               correlation coefficients for each pair of variables.
                     4.2. Baseline results
                     To  examine  the  relationship  between  the  efficiency  of  provincial-level  public
               administration and corporate technology investment level by estimating the following
               regression model:
                                   ℎ              = β  +  β                                             + β     + γ  +  ε   (1)
                                            0                                      2
                                                  1

                     Here,         ℎ              represents  the  corporate  technology  investment  index

               estimated in years t, TEC  and TEC .                                            stands Environmental
                                           1         2

               governance in year t. X is a vector of control variables, as presented in section 3.3,
               calculated in year t. The year-fixed effects (denoted as γ ) are included in our baseline

               model.  Importantly,  the  coefficient β  reflects  the  impact  of  public  administration
                                                        1


               efficiency on corporate technology investment. We adopted the Tobit model to conduct
               the regression analysis because TEC1 and TEC2 have many zero values, and we report
               the estimated regressions controlling for year-fixed effects in Table 2.
                     The coefficients of Environmental governance in Columns (1) to (4) are negative

               and statistically significant at a 1% level. For instance, the coefficients in columns (1)
               and (2) on TEC1 and TEC2 are -5.120 and -5.472, respectively. The negative coefficients
               indicate  that  when  citizens  are  aware  of  the  environment,  corporations  will  be
               encouraged to allocate more STD funds for science and technology transformation. The
               evidence agrees with our Hypotheses. The coefficients of control
                                                                                                      250