Page 649 - ISC PROCEEDINGS 21.4
P. 649

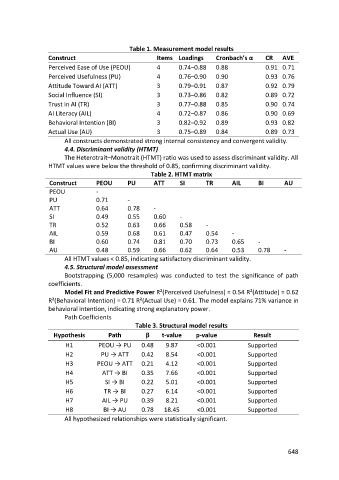
Table 1. Measurement model results
                  Construct                             Items Loadings       Cronbach’s α     CR    AVE
                  Perceived Ease of Use (PEOU)          4       0.74–0.88    0.88             0.91 0.71
                  Perceived Usefulness (PU)             4       0.76–0.90    0.90             0.93 0.76
                  Attitude Toward AI (ATT)              3       0.79–0.91    0.87             0.92 0.79
                  Social Influence (SI)                 3       0.73–0.86    0.82             0.89 0.72
                  Trust in AI (TR)                      3       0.77–0.88    0.85             0.90 0.74
                  AI Literacy (AIL)                     4       0.72–0.87    0.86             0.90 0.69
                  Behavioral Intention (BI)             3       0.82–0.92    0.89             0.93 0.82
                  Actual Use (AU)                       3       0.75–0.89    0.84             0.89 0.73
                        All constructs demonstrated strong internal consistency and convergent validity.
                        4.4. Discriminant validity (HTMT)
                        The Heterotrait–Monotrait (HTMT) ratio was used to assess discriminant validity. All
                  HTMT values were below the threshold of 0.85, confirming discriminant validity.
                                                      Table 2. HTMT matrix
                  Construct        PEOU       PU       ATT      SI       TR        AIL      BI       AU
                  PEOU             -
                  PU               0.71       -
                  ATT              0.64       0.78     -
                  SI               0.49       0.55     0.60     -
                  TR               0.52       0.63     0.66     0.58     -
                  AIL              0.59       0.68     0.61     0.47     0.54      -
                  BI               0.60       0.74     0.81     0.70     0.73      0.65     -
                  AU               0.48       0.59     0.66     0.62     0.64      0.53     0.78     -
                        All HTMT values < 0.85, indicating satisfactory discriminant validity.
                        4.5. Structural model assessment
                        Bootstrapping (5,000 resamples) was conducted to test the significance of path
                  coefficients.
                        Model Fit and Predictive Power R²(Perceived Usefulness) = 0.54 R²(Attitude) = 0.62
                  R²(Behavioral Intention) = 0.71 R²(Actual Use) = 0.61. The model explains 71% variance in
                  behavioral intention, indicating strong explanatory power.
                        Path Coefficients
                                                 Table 3. Structural model results
                    Hypothesis         Path         β     t-value     p-value             Result

                        H1          PEOU → PU      0.48    9.87       <0.001            Supported
                        H2          PU → ATT       0.42    8.54       <0.001            Supported
                        H3         PEOU → ATT      0.21    4.12       <0.001            Supported
                        H4           ATT → BI      0.35    7.66       <0.001            Supported
                        H5            SI → BI      0.22    5.01       <0.001            Supported
                        H6            TR → BI      0.27    6.14       <0.001            Supported
                        H7           AIL → PU      0.39    8.21       <0.001            Supported
                        H8           BI → AU       0.78    18.45      <0.001            Supported
                        All hypothesized relationships were statistically significant.


                                                                                                      648
   644   645   646   647   648   649   650   651   652   653   654