
Page 618 - ISC PROCEEDINGS 21.4
P. 618
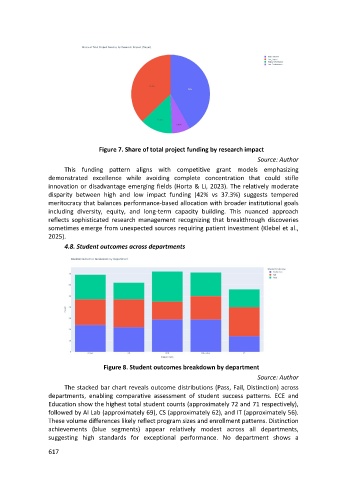
Figure 7. Share of total project funding by research impact
                                                                                           Source: Author
                        This funding pattern aligns with competitive grant models emphasizing
                  demonstrated excellence while avoiding complete concentration that could stifle
                  innovation or disadvantage emerging fields (Horta & Li, 2023). The relatively moderate
                  disparity between high and low impact funding (42% vs 37.3%) suggests tempered
                  meritocracy that balances performance-based allocation with broader institutional goals
                  including diversity, equity, and long-term capacity building. This nuanced approach
                  reflects sophisticated research management recognizing that breakthrough discoveries
                  sometimes emerge from unexpected sources requiring patient investment (Klebel et al.,
                  2025).
                        4.8. Student outcomes across departments


                                     Figure 8. Student outcomes breakdown by department

                                                                                           Source: Author
                        The stacked bar chart reveals outcome distributions (Pass, Fail, Distinction) across
                  departments, enabling comparative assessment of student success patterns. ECE and
                  Education show the highest total student counts (approximately 72 and 71 respectively),
                  followed by AI Lab (approximately 69), CS (approximately 62), and IT (approximately 56).
                  These volume differences likely reflect program sizes and enrollment patterns. Distinction
                  achievements (blue segments) appear relatively modest across all departments,
                  suggesting high standards for exceptional performance. No department shows a

                  617