
Page 616 - ISC PROCEEDINGS 21.4
P. 616
The temporal analysis reveals research output patterns from 2020 through 2024.
The year 2020 recorded approximately 435 research entities, followed by a decline to
approximately 370 entities in 2021. This drop likely reflects COVID-19 pandemic
disruptions affecting research activities globally during 2020-2021 (Elena & Lilia, 2018).
Output rebounded to approximately 435 entities in 2022, demonstrating institutional
resilience and adaptation to pandemic conditions. A slight dip to approximately 405
entities occurred in 2023, followed by a substantial increase to approximately 450 entities
in 2024, representing the highest output across the five-year period. This upward
trajectory suggests successful implementation of research support strategies and growing
institutional research capacity. The 2024 peak may reflect accumulated momentum from
earlier investments in research infrastructure, faculty development, and collaborative
networks. The overall pattern shows remarkable stability despite year-to-year
fluctuations, with total variance remaining within approximately 20% of the mean. This
consistency indicates effective institutional capacity to maintain research velocity across
changing external conditions. Unlike institutions experiencing dramatic productivity
swings, this university demonstrates sustainable research programs capable of
weathering disruptions while maintaining continuous output (Stackhouse & Day, 2005).
4.5. Collaboration and funding
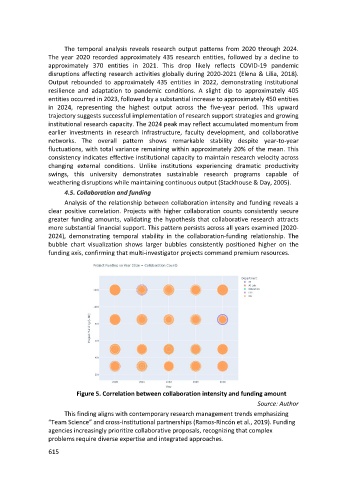
Analysis of the relationship between collaboration intensity and funding reveals a
clear positive correlation. Projects with higher collaboration counts consistently secure
greater funding amounts, validating the hypothesis that collaborative research attracts
more substantial financial support. This pattern persists across all years examined (2020-
2024), demonstrating temporal stability in the collaboration-funding relationship. The
bubble chart visualization shows larger bubbles consistently positioned higher on the
funding axis, confirming that multi-investigator projects command premium resources.
Figure 5. Correlation between collaboration intensity and funding amount
Source: Author
This finding aligns with contemporary research management trends emphasizing
“Team Science” and cross-institutional partnerships (Ramos-Rincón et al., 2019). Funding
agencies increasingly prioritize collaborative proposals, recognizing that complex
problems require diverse expertise and integrated approaches.
615