
Page 617 - ISC PROCEEDINGS 21.4
P. 617
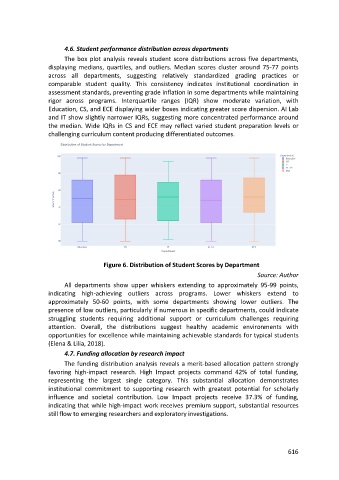
4.6. Student performance distribution across departments
                        The box plot analysis reveals student score distributions across five departments,
                  displaying medians, quartiles, and outliers. Median scores cluster around 75-77 points
                  across all departments, suggesting relatively standardized grading practices or
                  comparable student quality. This consistency indicates institutional coordination in
                  assessment standards, preventing grade inflation in some departments while maintaining
                  rigor across programs. Interquartile ranges (IQR) show moderate variation, with
                  Education, CS, and ECE displaying wider boxes indicating greater score dispersion. AI Lab
                  and IT show slightly narrower IQRs, suggesting more concentrated performance around
                  the median. Wide IQRs in CS and ECE may reflect varied student preparation levels or
                  challenging curriculum content producing differentiated outcomes.


                                     Figure 6. Distribution of Student Scores by Department
                                                                                           Source: Author
                        All departments show upper whiskers extending to approximately 95-99 points,
                  indicating high-achieving outliers across programs. Lower whiskers extend to
                  approximately 50-60 points, with some departments showing lower outliers. The
                  presence of low outliers, particularly if numerous in specific departments, could indicate
                  struggling students requiring additional support or curriculum challenges requiring
                  attention. Overall, the distributions suggest healthy academic environments with
                  opportunities for excellence while maintaining achievable standards for typical students
                  (Elena & Lilia, 2018).
                        4.7. Funding allocation by research impact

                        The funding distribution analysis reveals a merit-based allocation pattern strongly
                  favoring high-impact research. High Impact projects command 42% of total funding,
                  representing the largest single category. This substantial allocation demonstrates
                  institutional commitment to supporting research with greatest potential for scholarly
                  influence and societal contribution. Low Impact projects receive 37.3% of funding,
                  indicating that while high-impact work receives premium support, substantial resources
                  still flow to emerging researchers and exploratory investigations.


                                                                                                      616