Page 556 - ISC PROCEEDINGS 21.4
P. 556

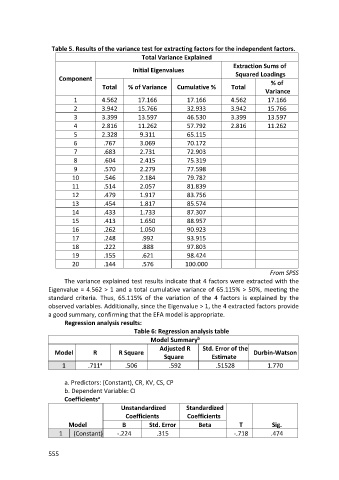
Table 5. Results of the variance test for extracting factors for the independent factors.
                                                   Total Variance Explained
                                                                                   Extraction Sums of
                                                Initial Eigenvalues
                      Component                                                     Squared Loadings
                                     Total    % of Variance    Cumulative %       Total         % of
                                                                                              Variance
                           1         4.562        17.166           17.166         4.562        17.166
                           2         3.942        15.766           32.933         3.942        15.766
                           3         3.399        13.597           46.530         3.399        13.597
                           4         2.816        11.262           57.792         2.816        11.262
                           5         2.328        9.311            65.115
                           6         .767         3.069            70.172
                           7         .683         2.731            72.903
                           8         .604         2.415            75.319
                           9         .570         2.279            77.598
                          10         .546         2.184            79.782
                          11         .514         2.057            81.839
                          12         .479         1.917            83.756
                          13         .454         1.817            85.574
                          14         .433         1.733            87.307
                          15         .413         1.650            88.957
                          16         .262         1.050            90.923
                          17         .248          .992            93.915
                          18         .222          .888            97.803
                          19         .155          .621            98.424
                          20         .144          .576           100.000
                                                                                                From SPSS
                        The variance explained test results indicate that 4 factors were extracted with the
                  Eigenvalue = 4.562 > 1 and a total cumulative variance of 65.115% > 50%, meeting the
                  standard criteria. Thus, 65.115% of the variation of the 4 factors is explained by the
                  observed variables. Additionally, since the Eigenvalue > 1, the 4 extracted factors provide
                  a good summary, confirming that the EFA model is appropriate.
                        Regression analysis results:
                                                Table 6: Regression analysis table
                                                      Model Summary   b
                                                         Adjusted R     Std. Error of the
                    Model         R        R Square                                       Durbin-Watson
                                                           Square          Estimate
                       1        .711 a       .506           .592             .51528            1.770


                        a. Predictors: (Constant), CR, KV, CS, CP
                        b. Dependent Variable: CI
                        Coefficients a
                                            Unstandardized        Standardized
                                             Coefficients          Coefficients
                         Model              B        Std. Error        Beta          T           Sig.
                      1    (Constant)     -.224         .315                       -.718        .474


                  555
   551   552   553   554   555   556   557   558   559   560   561