
Page 533 - ISC PROCEEDINGS 21.4
P. 533
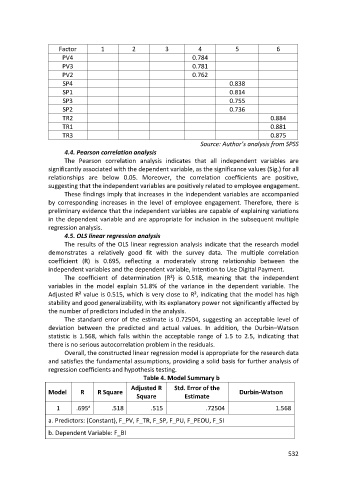
Factor         1         2           3           4            5             6
                       PV4                                           0.784
                       PV3                                           0.781
                       PV2                                           0.762
                       SP4                                                        0.838
                       SP1                                                        0.814
                       SP3                                                        0.755
                       SP2                                                        0.736
                       TR2                                                                      0.884
                       TR1                                                                      0.881
                       TR3                                                                      0.875
                                                                       Source: Author’s analysis from SPSS
                        4.4. Pearson correlation analysis
                        The Pearson correlation analysis indicates that all independent variables are
                  significantly associated with the dependent variable, as the significance values (Sig.) for all
                  relationships are below 0.05. Moreover, the correlation coefficients are positive,
                  suggesting that the independent variables are positively related to employee engagement.
                        These findings imply that increases in the independent variables are accompanied
                  by corresponding increases in the level of employee engagement. Therefore, there is
                  preliminary evidence that the independent variables are capable of explaining variations
                  in the dependent variable and are appropriate for inclusion in the subsequent multiple
                  regression analysis.
                        4.5. OLS linear regression analysis
                        The results of the OLS linear regression analysis indicate that the research model
                  demonstrates a relatively good fit with the survey data. The multiple correlation
                  coefficient (R) is 0.695, reflecting a moderately strong relationship between the
                  independent variables and the dependent variable, Intention to Use Digital Payment.
                        The coefficient of determination (R²) is 0.518, meaning that the independent
                  variables in the model explain 51.8% of the variance in the dependent variable. The
                  Adjusted R² value is 0.515, which is very close to R², indicating that the model has high
                  stability and good generalizability, with its explanatory power not significantly affected by
                  the number of predictors included in the analysis.
                        The standard error of the estimate is 0.72504, suggesting an acceptable level of
                  deviation between the predicted and actual values. In addition, the Durbin–Watson
                  statistic is 1.568, which falls within the acceptable range of 1.5 to 2.5, indicating that
                  there is no serious autocorrelation problem in the residuals.
                        Overall, the constructed linear regression model is appropriate for the research data
                  and satisfies the fundamental assumptions, providing a solid basis for further analysis of
                  regression coefficients and hypothesis testing.
                                                   Table 4. Model Summary b
                                               Adjusted R     Std. Error of the
                  Model      R     R Square                                          Durbin-Watson
                                                 Square           Estimate
                     1      .695 a      .518          .515               .72504                   1.568

                  a. Predictors: (Constant), F_PV, F_TR, F_SP, F_PU, F_PEOU, F_SI

                  b. Dependent Variable: F_BI


                                                                                                      532