
Page 532 - ISC PROCEEDINGS 21.4
P. 532
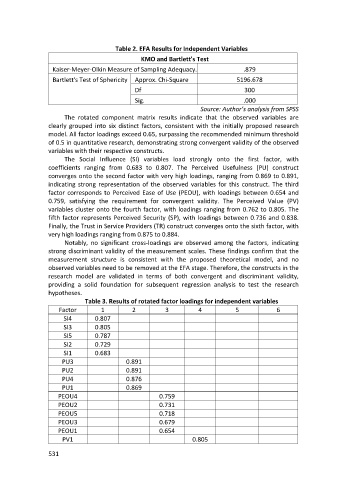
Table 2. EFA Results for Independent Variables
                                                   KMO and Bartlett's Test
                   Kaiser-Meyer-Olkin Measure of Sampling Adequacy.                    .879
                   Bartlett's Test of Sphericity  Approx. Chi-Square                5196.678

                                                Df                                     300
                                                Sig.                                   .000
                                                                       Source: Author’s analysis from SPSS
                        The rotated component matrix results indicate that the observed variables are
                  clearly grouped into six distinct factors, consistent with the initially proposed research
                  model. All factor loadings exceed 0.65, surpassing the recommended minimum threshold
                  of 0.5 in quantitative research, demonstrating strong convergent validity of the observed
                  variables with their respective constructs.
                        The Social Influence (SI) variables load strongly onto the first factor, with
                  coefficients ranging from 0.683 to 0.807. The Perceived Usefulness (PU) construct
                  converges onto the second factor with very high loadings, ranging from 0.869 to 0.891,
                  indicating strong representation of the observed variables for this construct. The third
                  factor corresponds to Perceived Ease of Use (PEOU), with loadings between 0.654 and
                  0.759, satisfying the requirement for convergent validity. The Perceived Value (PV)
                  variables cluster onto the fourth factor, with loadings ranging from 0.762 to 0.805. The
                  fifth factor represents Perceived Security (SP), with loadings between 0.736 and 0.838.
                  Finally, the Trust in Service Providers (TR) construct converges onto the sixth factor, with
                  very high loadings ranging from 0.875 to 0.884.
                        Notably, no significant cross-loadings are observed among the factors, indicating
                  strong discriminant validity of the measurement scales. These findings confirm that the
                  measurement structure is consistent with the proposed theoretical model, and no
                  observed variables need to be removed at the EFA stage. Therefore, the constructs in the
                  research model are validated in terms of both convergent and discriminant validity,
                  providing a solid foundation for subsequent regression analysis to test the research
                  hypotheses.
                               Table 3. Results of rotated factor loadings for independent variables
                      Factor         1         2           3           4            5             6
                       SI4        0.807
                       SI3        0.805
                       SI5        0.787
                       SI2        0.729
                       SI1        0.683
                       PU3                   0.891
                       PU2                   0.891
                       PU4                   0.876
                       PU1                   0.869
                     PEOU4                               0.759
                     PEOU2                               0.731
                     PEOU5                               0.718
                     PEOU3                               0.679
                     PEOU1                               0.654
                       PV1                                           0.805

                  531