Page 430 - ISC PROCEEDINGS 21.4
P. 430

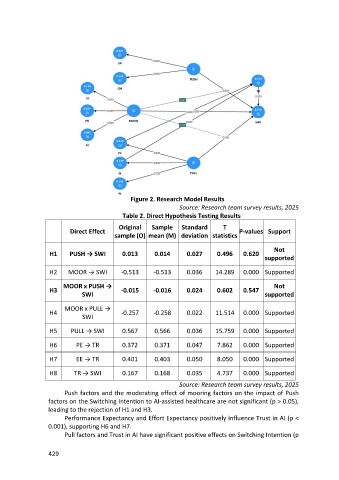
Figure 2. Research Model Results
                                                                Source: Research team survey results, 2025
                                            Table 2. Direct Hypothesis Testing Results

                                           Original   Sample     Standard      T
                          Direct Effect                                              P-values Support
                                         sample (O) mean (M) deviation statistics

                                                                                                 Not
                  H1     PUSH → SWI         0.013      0.014       0.027     0.496    0.620
                                                                                              supported

                  H2     MOOR → SWI         -0.513     -0.513      0.036     14.289   0.000 Supported

                       MOOR x PUSH →                                                             Not
                  H3                        -0.015     -0.016      0.024     0.602    0.547
                              SWI                                                             supported

                        MOOR x PULL →
                  H4                        -0.257     -0.258      0.022     11.514   0.000 Supported
                              SWI

                  H5      PULL → SWI        0.567      0.566       0.036     15.759   0.000 Supported
                  H6        PE → TR         0.372      0.371       0.047     7.862    0.000 Supported


                  H7        EE → TR         0.401      0.403       0.050     8.050    0.000 Supported

                  H8       TR → SWI         0.167      0.168       0.035     4.737    0.000 Supported
                                                                Source: Research team survey results, 2025
                        Push factors and the moderating effect of mooring factors on the impact of Push
                  factors on the Switching Intention to AI-assisted healthcare are not significant (p > 0.05),
                  leading to the rejection of H1 and H3.
                        Performance Expectancy and Effort Expectancy positively influence Trust in AI (p <
                  0.001), supporting H6 and H7.
                        Pull factors and Trust in AI have significant positive effects on Switching Intention (p


                  429
   425   426   427   428   429   430   431   432   433   434   435