
Page 429 - ISC PROCEEDINGS 21.4
P. 429
2.4.2. Analysis software
Given the exploratory nature of the integrated PPM framework and its focus on
novel relationships, PLS-SEM was deemed more appropriate than CB-SEM (Hair et al.,
2022).
3. Results and discussion
3.1. Results
Prior to SEM analysis, the study assessed scale reliability and validity as follows:
(1) Cronbach's Alpha ≥ 0.7, Composite reliability (rho_a ≥ 0.7 and rho_c ≥ 0.7)
confirmed that all indicators met reliability standards.
(2) Average variance extracted (AVE) ≥ 0.5 demonstrated convergent validity across
scales.
(3) The Fornell-Larcker criterion and Heterotrait-Monotrait (HTMT) Correlation
Ratios demonstrate that most construct pairs exhibit HTMT values ≤ 0.85, confirming
discriminant validity. Although one pair (EE-PE) shows HTMT ≥ 0.85, it remains within
acceptable thresholds (≤ 0.90).
Thus, all measurement scales in this study satisfied reliability, convergent validity
and discriminant validity criteria. Consequently, these scales were retained for
subsequent partial least squares structural equation modeling (PLS-SEM) analysis.
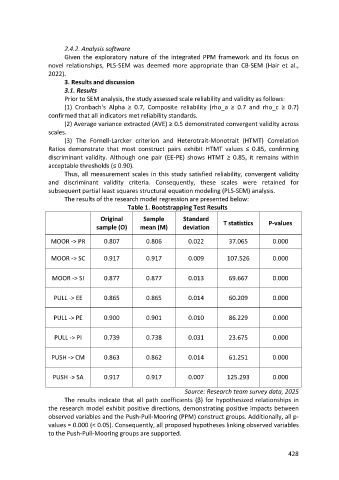
The results of the research model regression are presented below:
Table 1. Bootstrapping Test Results
Original Sample Standard
sample (O) mean (M) deviation T statistics P-values
MOOR -> PR 0.807 0.806 0.022 37.065 0.000
MOOR -> SC 0.917 0.917 0.009 107.526 0.000
MOOR -> SI 0.877 0.877 0.013 69.667 0.000
PULL -> EE 0.865 0.865 0.014 60.209 0.000
PULL -> PE 0.900 0.901 0.010 86.229 0.000
PULL -> PI 0.739 0.738 0.031 23.675 0.000
PUSH -> CM 0.863 0.862 0.014 61.251 0.000
PUSH -> SA 0.917 0.917 0.007 125.293 0.000
Source: Research team survey data, 2025
The results indicate that all path coefficients (β) for hypothesized relationships in
the research model exhibit positive directions, demonstrating positive impacts between
observed variables and the Push-Pull-Mooring (PPM) construct groups. Additionally, all p-
values = 0.000 (< 0.05). Consequently, all proposed hypotheses linking observed variables
to the Push-Pull-Mooring groups are supported.
428