
Page 419 - ISC PROCEEDINGS 21.4
P. 419
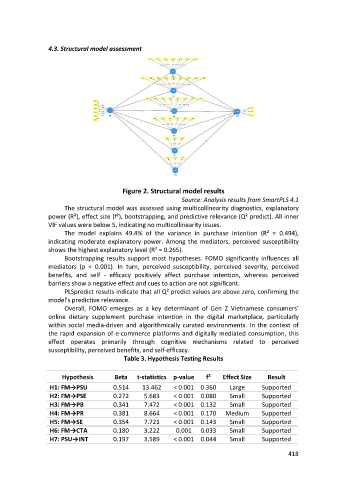
4.3. Structural model assessment


                                            Figure 2. Structural model results
                                                                 Source: Analysis results from SmartPLS 4.1
                        The structural model was assessed using multicollinearity diagnostics, explanatory
                  power (R²), effect size (f²), bootstrapping, and predictive relevance (Q² predict). All inner
                  VIF values were below 5, indicating no multicollinearity issues.
                        The model explains 49.4% of the variance in purchase intention (R² = 0.494),
                  indicating moderate explanatory power. Among the mediators, perceived susceptibility
                  shows the highest explanatory level (R² = 0.265).
                        Bootstrapping results support most hypotheses. FOMO significantly influences all
                  mediators (p < 0.001). In turn, perceived susceptibility, perceived severity, perceived
                  benefits, and self - efficacy positively affect purchase intention, whereas perceived
                  barriers show a negative effect and cues to action are not significant.
                        PLSpredict results indicate that all Q² predict values are above zero, confirming the
                  model’s predictive relevance.
                        Overall, FOMO emerges as a key determinant of Gen Z Vietnamese consumers’
                  online dietary supplement purchase intention in the digital marketplace, particularly
                  within social media-driven and algorithmically curated environments. In the context of
                  the rapid expansion of e-commerce platforms and digitally mediated consumption, this
                  effect operates primarily through cognitive mechanisms related to perceived
                  susceptibility, perceived benefits, and self-efficacy.
                                             Table 3. Hypothesis Testing Results


                       Hypothesis        Beta    t-statistics p-value    f²    Effect Size     Result
                   H1: FM→PSU            0.514     13.462     < 0.001 0.360       Large      Supported
                   H2: FM→PSE            0.272      5.683     < 0.001 0.080       Small      Supported
                   H3: FM→PB             0.341      7.472     < 0.001 0.132       Small      Supported
                   H4: FM→PR             0.381      8.664     < 0.001 0.170     Medium       Supported
                   H5: FM→SE             0.354      7.721     < 0.001 0.143       Small      Supported
                   H6: FM→CTA            0.180      3.222      0.001   0.033      Small      Supported
                   H7: PSU→INT           0.197      3.589     < 0.001 0.044       Small      Supported

                                                                                                      418