Page 417 - ISC PROCEEDINGS 21.4
P. 417

3 million VND. Additionally, 61.7% reported frequent engagement in online shopping.
                        4.2. Measurement model assessment
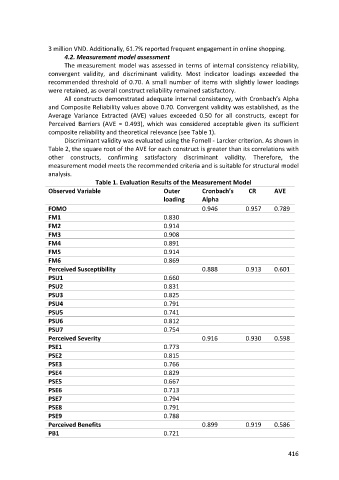
                        The measurement model was assessed in terms of internal consistency reliability,
                  convergent validity, and discriminant validity. Most indicator loadings exceeded the
                  recommended threshold of 0.70. A small number of items with slightly lower loadings
                  were retained, as overall construct reliability remained satisfactory.
                        All constructs demonstrated adequate internal consistency, with Cronbach’s Alpha
                  and Composite Reliability values above 0.70. Convergent validity was established, as the
                  Average Variance Extracted (AVE) values exceeded 0.50 for all constructs, except for
                  Perceived Barriers (AVE = 0.493), which was considered acceptable given its sufficient
                  composite reliability and theoretical relevance (see Table 1).
                        Discriminant validity was evaluated using the Fornell - Larcker criterion. As shown in
                  Table 2, the square root of the AVE for each construct is greater than its correlations with
                  other constructs, confirming satisfactory discriminant validity.        Therefore, the
                  measurement model meets the recommended criteria and is suitable for structural model
                  analysis.
                                   Table 1. Evaluation Results of the Measurement Model
                  Observed Variable                        Outer        Cronbach’s      CR       AVE
                                                           loading      Alpha
                  FOMO                                                  0.946          0.957     0.789
                  FM1                                      0.830
                  FM2                                      0.914
                  FM3                                      0.908
                  FM4                                      0.891
                  FM5                                      0.914
                  FM6                                      0.869
                  Perceived Susceptibility                              0.888          0.913     0.601
                  PSU1                                     0.660
                  PSU2                                     0.831
                  PSU3                                     0.825
                  PSU4                                     0.791
                  PSU5                                     0.741
                  PSU6                                     0.812
                  PSU7                                     0.754
                  Perceived Severity                                    0.916          0.930     0.598
                  PSE1                                     0.773
                  PSE2                                     0.815
                  PSE3                                     0.766
                  PSE4                                     0.829
                  PSE5                                     0.667
                  PSE6                                     0.713
                  PSE7                                     0.794
                  PSE8                                     0.791
                  PSE9                                     0.788
                  Perceived Benefits                                    0.899          0.919     0.586
                  PB1                                      0.721


                                                                                                      416
   412   413   414   415   416   417   418   419   420   421   422