
Page 264 - ISC PROCEEDINGS 21.4
P. 264
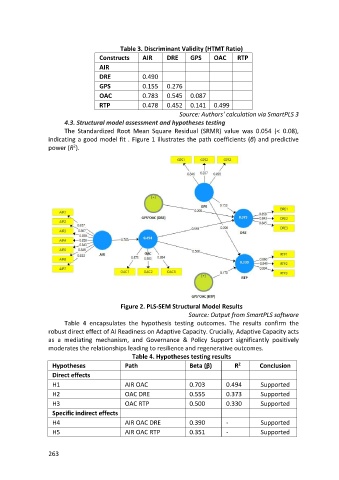
Table 3. Discriminant Validity (HTMT Ratio)
                                    Constructs     AIR      DRE     GPS     OAC     RTP
                                    AIR
                                    DRE            0.490
                                    GPS            0.155    0.276
                                    OAC            0.783    0.545   0.087
                                    RTP            0.478    0.452   0.141   0.499
                                                                Source: Authors' calculation via SmartPLS 3
                        4.3. Structural model assessment and hypotheses testing
                        The Standardized Root Mean Square Residual (SRMR) value was 0.054 (< 0.08),
                  indicating a good model fit . Figure 1 illustrates the path coefficients (β) and predictive
                  power (R ).
                           2


                                           Figure 2. PLS-SEM Structural Model Results
                                                                   Source: Output from SmartPLS software
                        Table 4 encapsulates the hypothesis testing outcomes. The results confirm the
                  robust direct effect of AI Readiness on Adaptive Capacity. Crucially, Adaptive Capacity acts
                  as a mediating mechanism, and Governance & Policy Support significantly positively
                  moderates the relationships leading to resilience and regenerative outcomes.
                                               Table 4. Hypotheses testing results
                   Hypotheses                Path                   Beta (β)       R 2      Conclusion
                   Direct effects
                   H1                        AIR OAC                0.703       0.494        Supported
                   H2                        OAC DRE                0.555       0.373        Supported
                   H3                        OAC RTP                0.500       0.330        Supported

                   Specific indirect effects
                   H4                        AIR OAC DRE            0.390       -            Supported
                   H5                        AIR OAC RTP            0.351       -            Supported


                  263