
Page 262 - ISC PROCEEDINGS 21.4
P. 262
- "We can swiftly reallocate resources (financial and human) based on real-time AI
data."
Destination resilience (DRE): Measuring the perceived contribution of the firm to
the broader destination's recovery:
- "Our operational continuity significantly helps maintain local employment during
crises."
- "Our business practices contribute to the rapid recovery of visitor trust in the
destination."
Regenerative tourism practices (RTP): Measuring proactive ecological and social
restoration:
- "Our firm utilizes smart technologies to actively reduce carbon emissions and
minimize waste."
- "We actively engage in practices that restore and improve the local ecological
environment."
Governance and policy support (GPS): Measuring the moderating effect of the
institutional environment:
- "Local government provides sufficient digital infrastructure (e.g., high-speed
internet, data security laws) to support AI adoption."
- "There are adequate financial incentives or training programs from authorities for
tech-driven SMEs."
3.4. Data analysis method
The collected data will be analyzed using Partial Least Squares Structural Equation
Modeling (PLS-SEM) via SmartPLS software. PLS-SEM is particularly suitable for this study
because it excels at handling complex models that include multi-dimensional constructs,
mediating effects, and moderating variables, and it is highly effective for exploratory
research aimed at theory development. The analysis will proceed in two stages: first,
assessing the reliability and validity of the measurement model (outer model); and
second, testing the hypothesized paths and the significance of the mediating and
moderating effects within the structural model (inner model).
4. Results and discussion
4.1. Sample characteristics
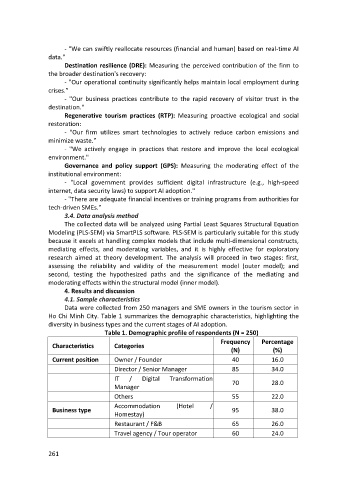
Data were collected from 250 managers and SME owners in the tourism sector in
Ho Chi Minh City. Table 1 summarizes the demographic characteristics, highlighting the
diversity in business types and the current stages of AI adoption.
Table 1. Demographic profile of respondents (N = 250)
Frequency Percentage
Characteristics Categories
(N) (%)
Current position Owner / Founder 40 16.0
Director / Senior Manager 85 34.0
IT / Digital Transformation
Manager 70 28.0
Others 55 22.0
Accommodation (Hotel /
Business type 95 38.0
Homestay)
Restaurant / F&B 65 26.0
Travel agency / Tour operator 60 24.0
261