
Page 263 - ISC PROCEEDINGS 21.4
P. 263
Frequency Percentage
Characteristics Categories
(N) (%)
Others 30 12.0
Number of Under 10 employees 80 32.0
employees
10 - 50 employees 70 28.0
51 - 100 employees 45 18.0
Above 100 employees 55 22.0
AI adoption level Exploring / Testing phase 110 44.0
Partially adopted 85 34.0
Fully integrated into operations 55 22.0
Source: Authors' survey data (2026)
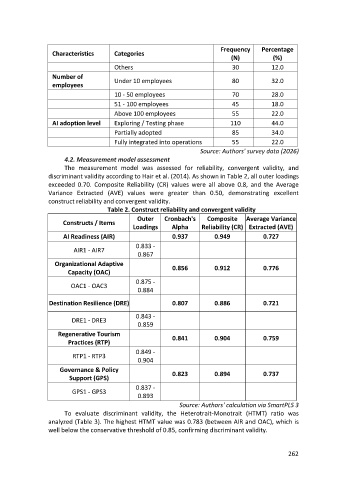
4.2. Measurement model assessment
The measurement model was assessed for reliability, convergent validity, and
discriminant validity according to Hair et al. (2014). As shown in Table 2, all outer loadings
exceeded 0.70. Composite Reliability (CR) values were all above 0.8, and the Average
Variance Extracted (AVE) values were greater than 0.50, demonstrating excellent
construct reliability and convergent validity.
Table 2. Construct reliability and convergent validity
Outer Cronbach's Composite Average Variance
Constructs / Items
Loadings Alpha Reliability (CR) Extracted (AVE)
AI Readiness (AIR) 0.937 0.949 0.727
0.833 -
AIR1 - AIR7
0.867
Organizational Adaptive 0.856 0.912 0.776
Capacity (OAC)
0.875 -
OAC1 - OAC3
0.884
Destination Resilience (DRE) 0.807 0.886 0.721
0.843 -
DRE1 - DRE3
0.859
Regenerative Tourism 0.841 0.904 0.759
Practices (RTP)
0.849 -
RTP1 - RTP3
0.904
Governance & Policy 0.823 0.894 0.737
Support (GPS)
0.837 -
GPS1 - GPS3
0.893
Source: Authors' calculation via SmartPLS 3
To evaluate discriminant validity, the Heterotrait-Monotrait (HTMT) ratio was
analyzed (Table 3). The highest HTMT value was 0.783 (between AIR and OAC), which is
well below the conservative threshold of 0.85, confirming discriminant validity.
262