
Page 179 - ISC PROCEEDINGS 21.4
P. 179
threshold inequality-amplifying mechanism dominates, while high-income economies
must already address platform concentration.
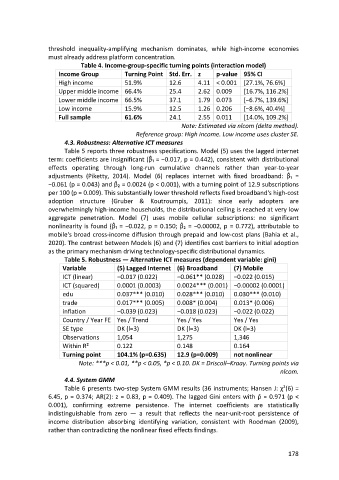
Table 4. Income-group-specific turning points (interaction model)
Income Group Turning Point Std. Err. z p-value 95% CI
High income 51.9% 12.6 4.11 < 0.001 [27.1%, 76.6%]
Upper middle income 66.4% 25.4 2.62 0.009 [16.7%, 116.2%]
Lower middle income 66.5% 37.1 1.79 0.073 [−6.7%, 139.6%]
Low income 15.9% 12.5 1.26 0.206 [−8.6%, 40.4%]
Full sample 61.6% 24.1 2.55 0.011 [14.0%, 109.2%]
Note: Estimated via nlcom (delta method).
Reference group: High income. Low income uses cluster SE.
4.3. Robustness: Alternative ICT measures
Table 5 reports three robustness specifications. Model (5) uses the lagged internet
̂
term: coefficients are insignificant (β₁ = −0.017, p = 0.442), consistent with distributional
effects operating through long-run cumulative channels rather than year-to-year
adjustments (Piketty, 2014). Model (6) replaces internet with fixed broadband: β₁ =
̂
−0.061 (p = 0.043) and β₂ = 0.0024 (p < 0.001), with a turning point of 12.9 subscriptions
̂
per 100 (p = 0.009). This substantially lower threshold reflects fixed broadband's high-cost
adoption structure (Gruber & Koutroumpis, 2011): since early adopters are
overwhelmingly high-income households, the distributional ceiling is reached at very low
aggregate penetration. Model (7) uses mobile cellular subscriptions: no significant
̂
nonlinearity is found (β₁ = −0.022, p = 0.150; β₂ = −0.00002, p = 0.772), attributable to
̂
mobile's broad cross-income diffusion through prepaid and low-cost plans (Bahia et al.,
2020). The contrast between Models (6) and (7) identifies cost barriers to initial adoption
as the primary mechanism driving technology-specific distributional dynamics.
Table 5. Robustness — Alternative ICT measures (dependent variable: gini)
Variable (5) Lagged Internet (6) Broadband (7) Mobile
ICT (linear) −0.017 (0.022) −0.061** (0.028) −0.022 (0.015)
ICT (squared) 0.0001 (0.0003) 0.0024*** (0.001) −0.00002 (0.0001)
edu 0.037*** (0.010) 0.028*** (0.010) 0.030*** (0.010)
trade 0.017*** (0.005) 0.008* (0.004) 0.013* (0.006)
inflation −0.039 (0.023) −0.018 (0.023) −0.022 (0.022)
Country / Year FE Yes / Trend Yes / Yes Yes / Yes
SE type DK (l=3) DK (l=3) DK (l=3)
Observations 1,054 1,275 1,346
Within R² 0.122 0.148 0.164
Turning point 104.1% (p=0.635) 12.9 (p=0.009) not nonlinear
Note: ***p < 0.01, **p < 0.05, *p < 0.10. DK = Driscoll–Kraay. Turning points via
nlcom.
4.4. System GMM
Table 6 presents two-step System GMM results (36 instruments; Hansen J: χ²(6) =
6.45, p = 0.374; AR(2): z = 0.83, p = 0.409). The lagged Gini enters with ρ̂ = 0.971 (p <
0.001), confirming extreme persistence. The internet coefficients are statistically
indistinguishable from zero — a result that reflects the near-unit-root persistence of
income distribution absorbing identifying variation, consistent with Roodman (2009),
rather than contradicting the nonlinear fixed effects findings.
178