
Page 178 - ISC PROCEEDINGS 21.4
P. 178
specification employs Driscoll–Kraay (1998) standard errors (xtscc, lag l = 3),
simultaneously robust to heteroskedasticity, serial autocorrelation, and spatial
dependence. Results are presented in parallel for OLS, cluster-robust, and Driscoll–Kraay
standard errors. To address reverse causality, we employ two-step System GMM
(Arellano & Bond, 1991; Blundell & Bond, 1998) via xtabond2 (Roodman, 2009) with a
collapsed instrument set (36 instruments) and Windmeijer-corrected standard errors.
4. Results
4.1. Baseline: U-shaped internet–inequality relationship
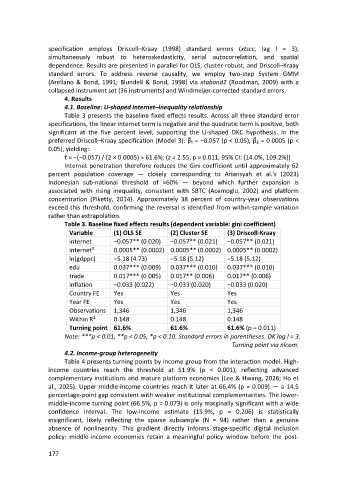
Table 3 presents the baseline fixed effects results. Across all three standard error
specifications, the linear internet term is negative and the quadratic term is positive, both
significant at the five percent level, supporting the U-shaped DKC hypothesis. In the
̂
̂
preferred Driscoll–Kraay specification (Model 3): β₁ = −0.057 (p < 0.05), β₂ = 0.0005 (p <
0.05), yielding:
τ̂ = −(−0.057) / (2 × 0.0005) ≈ 61.6%; (z = 2.55, p = 0.011, 95% CI: [14.0%, 109.2%])
Internet penetration therefore reduces the Gini coefficient until approximately 62
percent population coverage — closely corresponding to Ariansyah et al.'s (2023)
Indonesian sub-national threshold of ≈60% — beyond which further expansion is
associated with rising inequality, consistent with SBTC (Acemoglu, 2002) and platform
concentration (Piketty, 2014). Approximately 38 percent of country-year observations
exceed this threshold, confirming the reversal is identified from within-sample variation
rather than extrapolation.
Table 3. Baseline fixed effects results (dependent variable: gini coefficient)
Variable (1) OLS SE (2) Cluster SE (3) Driscoll-Kraay
internet −0.057** (0.020) −0.057** (0.021) −0.057** (0.021)
internet² 0.0005** (0.0002) 0.0005** (0.0002) 0.0005** (0.0002)
ln(gdppc) −5.18 (4.73) −5.18 (5.12) −5.18 (5.12)
edu 0.037*** (0.009) 0.037*** (0.010) 0.037*** (0.010)
trade 0.017*** (0.005) 0.017** (0.006) 0.017** (0.006)
inflation −0.033 (0.022) −0.033 (0.020) −0.033 (0.020)
Country FE Yes Yes Yes
Year FE Yes Yes Yes
Observations 1,346 1,346 1,346
Within R² 0.148 0.148 0.148
Turning point 61.6% 61.6% 61.6% (p = 0.011)
Note: ***p < 0.01, **p < 0.05, *p < 0.10. Standard errors in parentheses. DK lag l = 3.
Turning point via nlcom.
4.2. Income-group heterogeneity
Table 4 presents turning points by income group from the interaction model. High-
income countries reach the threshold at 51.9% (p < 0.001), reflecting advanced
complementary institutions and mature platform economies (Lee & Hwang, 2026; Ho et
al., 2025). Upper middle-income countries reach it later at 66.4% (p = 0.009) — a 14.5
percentage-point gap consistent with weaker institutional complementarities. The lower-
middle-income turning point (66.5%, p = 0.073) is only marginally significant with a wide
confidence interval. The low-income estimate (15.9%, p = 0.206) is statistically
insignificant, likely reflecting the sparse subsample (N = 94) rather than a genuine
absence of nonlinearity. This gradient directly informs stage-specific digital inclusion
policy: middle-income economies retain a meaningful policy window before the post-
177