
Page 177 - ISC PROCEEDINGS 21.4
P. 177
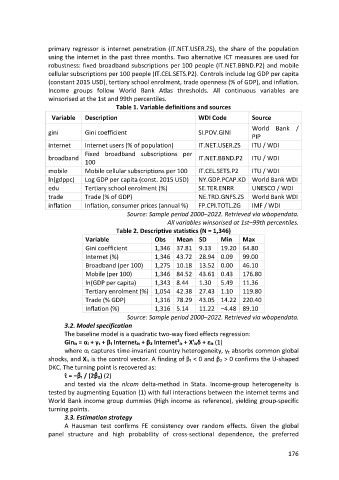
primary regressor is internet penetration (IT.NET.USER.ZS), the share of the population
                  using the internet in the past three months. Two alternative ICT measures are used for
                  robustness: fixed broadband subscriptions per 100 people (IT.NET.BBND.P2) and mobile
                  cellular subscriptions per 100 people (IT.CEL.SETS.P2). Controls include log GDP per capita
                  (constant 2015 USD), tertiary school enrolment, trade openness (% of GDP), and inflation.
                  Income groups follow World Bank Atlas thresholds. All continuous variables are
                  winsorised at the 1st and 99th percentiles.
                                          Table 1. Variable definitions and sources

                   Variable    Description                             WDI Code           Source
                                                                                          World Bank /
                  gini         Gini coefficient                        SI.POV.GINI
                                                                                          PIP
                  internet     Internet users (% of population)        IT.NET.USER.ZS     ITU / WDI
                               Fixed broadband subscriptions per
                  broadband                                            IT.NET.BBND.P2     ITU / WDI
                               100
                  mobile       Mobile cellular subscriptions per 100   IT.CEL.SETS.P2     ITU / WDI
                  ln(gdppc)    Log GDP per capita (const. 2015 USD)    NY.GDP.PCAP.KD World Bank WDI
                  edu          Tertiary school enrolment (%)           SE.TER.ENRR        UNESCO / WDI
                  trade        Trade (% of GDP)                        NE.TRD.GNFS.ZS     World Bank WDI
                  inflation    Inflation, consumer prices (annual %)   FP.CPI.TOTL.ZG     IMF / WDI
                                              Source: Sample period 2000–2022. Retrieved via wbopendata.
                                                            All variables winsorised at 1st–99th percentiles.
                                          Table 2. Descriptive statistics (N = 1,346)
                               Variable                Obs     Mean SD         Min    Max
                               Gini coefficient        1,346 37.81     9.13    19.20 64.80
                               Internet (%)            1,346 43.72     28.94 0.09     99.00
                               Broadband (per 100)     1,275 10.18     13.52 0.00     46.10
                               Mobile (per 100)        1,346 84.52     43.61 0.43     176.80
                               ln(GDP per capita)      1,343 8.44      1.30    5.49   11.36
                               Tertiary enrolment (%) 1,054 42.38      27.43 1.10     119.80
                               Trade (% GDP)           1,316 78.29     43.05 14.22 220.40
                               Inflation (%)           1,316 5.14      11.22 −4.48 89.10
                                              Source: Sample period 2000–2022. Retrieved via wbopendata.
                        3.2. Model specification
                        The baseline model is a quadratic two-way fixed effects regression:
                        Ginᵢₜ = αᵢ + γₜ + β₁ Internetᵢₜ + β₂ Internet²ᵢₜ + X′ᵢₜδ + εᵢₜ (1)
                        where αᵢ captures time-invariant country heterogeneity, γₜ absorbs common global
                  shocks, and Xᵢₜ is the control vector. A finding of β₁ < 0 and β₂ > 0 confirms the U-shaped
                  DKC. The turning point is recovered as:
                         ̂
                        τ = −β̂₁ / (2β̂₂) (2)
                        and tested via the nlcom delta-method in Stata. Income-group heterogeneity is
                  tested by augmenting Equation (1) with full interactions between the internet terms and
                  World Bank income group dummies (High income as reference), yielding group-specific
                  turning points.
                        3.3. Estimation strategy
                        A Hausman test confirms FE consistency over random effects. Given the global
                  panel structure and high probability of cross-sectional dependence, the preferred


                                                                                                      176