
Page 428 - Ebook HTKH 2024
P. 428
50 + 8 x 5 = 90 (Tabachnick et al., 1996). Our survey was conducted from June 2024 to
September 2024. Likert scale with five levels (1 to 5) was applied: 1 - Very low; 2 -
Low; 3 - Medium; 4 - High; 5 - Very high.
4.2. Research model
The proposed model includes 5 variables: characteristics of textile enterprises
(DM), managers' awareness of green accounting (NT), the process of collecting and
processing accounting information in enterprises (QT), the qualifications of accountants
(NL), relevant legal regulations and requirements in providing information on green
accounting (YC) and 01 dependent variable is green accounting (GA), the total number
of observed variables is 25 (including 03 observed variables of GA). The general
hypothesis is that all 5 factors have a positive impact on environmental accounting.
4.3. Research data
Statistical results from the survey: valid survey forms were 261/294 forms -
Regarding the subjects participating in answering the survey forms: 95% are
accountants of textile and garment enterprises
- Characteristics of the collected Vietnamese textile and garment enterprises: small
and medium-sized companies account for over 80%. Garment companies account for
the largest proportion (84%), followed by textile and spinning companies (15%)”.
Currently, Vietnamese textile and garment enterprises are almost only involved in the
final product production stage, which is considered to create the lowest added value,
with a profit margin of only about 5%-10%.
Data collected on the survey forms were evaluated by using SPSS 23.0.
5. Research result
Other results collected from data processing Scale reliability assessment:
Cronbach's Alpha reliability coefficient reflected a close correlation between observed
variables in the same factor. All factors ensure Cronbach Alpha reliability of 0.6 or
higher (Hair, J., & Alamer, A., 2022), suitable for exploratory factor analysis.
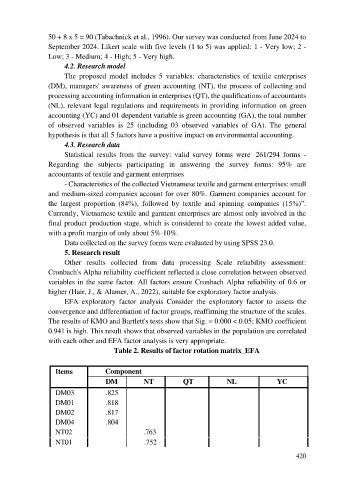
EFA exploratory factor analysis Consider the exploratory factor to assess the
convergence and differentiation of factor groups, reaffirming the structure of the scales.
The results of KMO and Bartlett's tests show that Sig. = 0.000 < 0.05; KMO coefficient
0.941 is high. This result shows that observed variables in the population are correlated
with each other and EFA factor analysis is very appropriate.
Table 2. Results of factor rotation matrix_EFA
Items Component
DM NT QT NL YC
DM03 .825
DM01 .818
DM02 .817
DM04 .804
NT02 .763
NT01 .752
420