


Page 76 - ISC PROCEEDINGS 21.4
P. 76
Recent studies have increasingly applied Grey Relational Analysis (GRA) to evaluate
                  factors influencing domains associated with the digital economy. Wang Q. et al. (2024)
                  integrated GRA with Interpretive Structural Modeling (ISM) to delineate the influence
                  structure among elements of the digital economy in China. Guo F.H. (2022) employed
                  GRA to rank the relative importance of determinants impacting digital finance, whereas
                  Sun X. et al. (2024) combined GRA with a Vector Autoregression (VAR) model to analyze
                  the degree of integration between the digital economy and traditional economic sectors.
                  A synthesis of the aforementioned literature reveals that each methodological paradigm
                  possesses distinct advantages. Regression techniques and panel data approaches are
                  highly suitable for investigating heterogeneities across multiple spatial units; structural
                  models are optimal for deciphering complex causal relationships; conversely, GRA-based
                  methodologies prove exceptionally efficacious when the primary objective is to evaluate
                  the relative magnitude of influence among variables under conditions of limited or
                  incomplete information.
                        Originating from the characteristics of the dataset and the overarching research
                  objectives, this study selects Grey Relational Analysis (GRA) as its foundational analytical
                  methodology. GRA is a fundamental component of grey system theory, originally
                  proposed by Deng Julong (1989), which aims to mathematically measure the degree of
                  proximity between data sequences through the conceptual framework of grey
                  relationships. This specific methodological approach permits the precise determination of
                  the relative magnitude of influence exerted by individual independent variables upon a
                  dependent variable, notably without necessitating strict a priori assumptions regarding
                  probability distributions or linear relationships. The principal econometric advantage of
                  GRA lies in its robust capacity to process small-sample data, incomplete datasets, and
                  variables characterized by heterogeneous measurement scales; thus, it is exceptionally
                  well-suited for analyzing aggregated national-level macroeconomic data over a
                  constrained temporal horizon. The quantitative component of this research utilizes GRA
                  to rank the independent variables based on their relational grade with the dependent
                  variable-specifically, GDP-thereby facilitating the empirical identification of critical factors
                  that warrant targeted policy prioritization. This analytical technique is particularly
                  pertinent within the context of Vietnamese empirical data, which frequently exhibits
                  inherent limitations in time-series length and underlying uncertainty (Liu & Lin, 2025).
                  Consequently, the empirical analysis is executed utilizing GRA in strict adherence to
                  established standard procedural protocols (Deng, 1982; Liu & Lin, 2025):
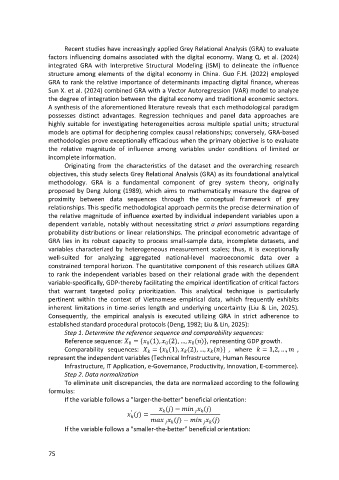
                        Step 1. Determine the reference sequence and comparability sequences:
                        Reference sequence:   = {  (1),   (2), …,   ( )}, representing GDP growth.
                                              0
                                                     0
                                                           0
                                                                    0
                        Comparability sequences:   = {  (1),   (2), …,   ( )} , where   = 1,2, …,   ,


                  represent the independent variables (Technical Infrastructure, Human Resource
                        Infrastructure, IT Application, e-Governance, Productivity, Innovation, E-commerce).
                        Step 2. Data normalization
                        To eliminate unit discrepancies, the data are normalized according to the following
                  formulas:
                        If the variable follows a "larger-the-better" beneficial orientation:
                                                           ( ) −        ( )


                                               '
                                                ( ) =

                                                             ( ) −        ( )


                        If the variable follows a "smaller-the-better" beneficial orientation:
                  75

