
Page 718 - ISC PROCEEDINGS 21.4
P. 718
EffectSize
Outcome Indicator T0 T1 Δ Test / p
(95% CI)
Correct interpretation
of I² in meta-analysis 8% 68% +60 pp McNemar, φ = 0.77
(3/37)
(25/37)
p<0.001
(%)
Correct identification 16% 78% +62 pp McNemar, φ = 0.79
of ≥3 confounders (%) (6/37) (29/37) p<0.001
Task completion time 135±24 22±8 −83.7% Paired t, d = 4.5 (95%
(min, mean±SD) p<0.001 CI: 3.2-5.8)
Self-confidence (Likert 1.8±0.6 4.1±0.5 +2.3 Wilcoxon, d = 4.2 (95%
1-5, mean±SD) p<0.001 CI: 3.0-5.4)
pp: percentage points; SD: standard deviation. Effect sizes (φ for binary variables,
Cohen’s d for continuous) were calculated using standard formulas [15]; large threshold:
φ > 0.50, d > 0.80.
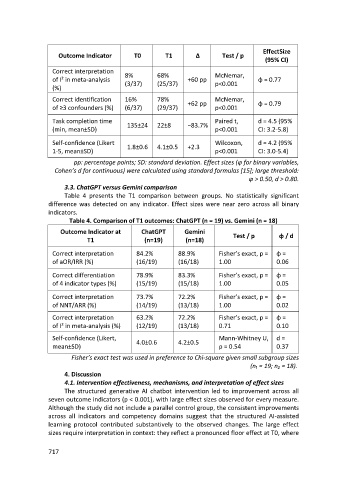
3.3. ChatGPT versus Gemini comparison
Table 4 presents the T1 comparison between groups. No statistically significant
difference was detected on any indicator. Effect sizes were near zero across all binary
indicators.
Table 4. Comparison of T1 outcomes: ChatGPT (n = 19) vs. Gemini (n = 18)
Outcome Indicator at ChatGPT Gemini Test / p φ / d
T1 (n=19) (n=18)
Correct interpretation 84.2% 88.9% Fisher’s exact, p = φ =
of aOR/IRR (%) (16/19) (16/18) 1.00 0.06
Correct differentiation 78.9% 83.3% Fisher’s exact, p = φ =
of 4 indicator types (%) (15/19) (15/18) 1.00 0.05
Correct interpretation 73.7% 72.2% Fisher’s exact, p = φ =
of NNT/ARR (%) (14/19) (13/18) 1.00 0.02
Correct interpretation 63.2% 72.2% Fisher’s exact, p = φ =
of I² in meta-analysis (%) (12/19) (13/18) 0.71 0.10
Self-confidence (Likert, Mann-Whitney U, d =
mean±SD) 4.0±0.6 4.2±0.5 p = 0.54 0.37
Fisher’s exact test was used in preference to Chi-square given small subgroup sizes
(n₁ = 19; n₂ = 18).
4. Discussion
4.1. Intervention effectiveness, mechanisms, and interpretation of effect sizes
The structured generative AI chatbot intervention led to improvement across all
seven outcome indicators (p < 0.001), with large effect sizes observed for every measure.
Although the study did not include a parallel control group, the consistent improvements
across all indicators and competency domains suggest that the structured AI-assisted
learning protocol contributed substantively to the observed changes. The large effect
sizes require interpretation in context: they reflect a pronounced floor effect at T0, where
717