
Page 707 - ISC PROCEEDINGS 21.4
P. 707
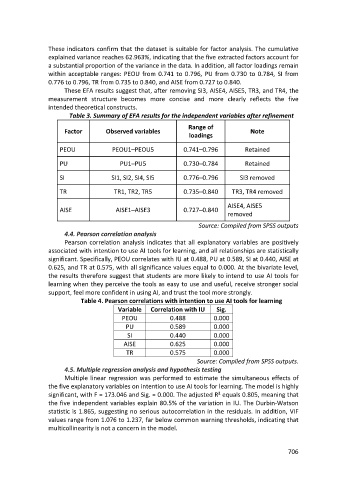
These indicators confirm that the dataset is suitable for factor analysis. The cumulative
                  explained variance reaches 62.963%, indicating that the five extracted factors account for
                  a substantial proportion of the variance in the data. In addition, all factor loadings remain
                  within acceptable ranges: PEOU from 0.741 to 0.796, PU from 0.730 to 0.784, SI from
                  0.776 to 0.796, TR from 0.735 to 0.840, and AISE from 0.727 to 0.840.
                        These EFA results suggest that, after removing SI3, AISE4, AISE5, TR3, and TR4, the
                  measurement structure becomes more concise and more clearly reflects the five
                  intended theoretical constructs.
                         Table 3. Summary of EFA results for the independent variables after refinement

                                                                   Range of
                        Factor        Observed variables                                 Note
                                                                   loadings

                      PEOU              PEOU1–PEOU5              0.741–0.796           Retained

                      PU                   PU1–PU5               0.730–0.784           Retained

                      SI                SI1, SI2, SI4, SI5       0.776–0.796         SI3 removed

                      TR                 TR1, TR2, TR5           0.735–0.840       TR3, TR4 removed

                                                                                 AISE4, AISE5
                      AISE                AISE1–AISE3            0.727–0.840
                                                                                 removed
                                                                       Source: Compiled from SPSS outputs
                        4.4. Pearson correlation analysis
                        Pearson correlation analysis indicates that all explanatory variables are positively
                  associated with intention to use AI tools for learning, and all relationships are statistically
                  significant. Specifically, PEOU correlates with IU at 0.488, PU at 0.589, SI at 0.440, AISE at
                  0.625, and TR at 0.575, with all significance values equal to 0.000. At the bivariate level,
                  the results therefore suggest that students are more likely to intend to use AI tools for
                  learning when they perceive the tools as easy to use and useful, receive stronger social
                  support, feel more confident in using AI, and trust the tool more strongly.
                             Table 4. Pearson correlations with intention to use AI tools for learning
                                          Variable    Correlation with IU    Sig.
                                            PEOU             0.488          0.000
                                             PU              0.589          0.000
                                              SI             0.440          0.000
                                            AISE             0.625          0.000
                                             TR              0.575          0.000
                                                                      Source: Compiled from SPSS outputs.
                        4.5. Multiple regression analysis and hypothesis testing
                        Multiple linear regression was performed to estimate the simultaneous effects of
                  the five explanatory variables on intention to use AI tools for learning. The model is highly
                  significant, with F = 173.046 and Sig. = 0.000. The adjusted R² equals 0.805, meaning that
                  the five independent variables explain 80.5% of the variation in IU. The Durbin-Watson
                  statistic is 1.865, suggesting no serious autocorrelation in the residuals. In addition, VIF
                  values range from 1.076 to 1.237, far below common warning thresholds, indicating that
                  multicollinearity is not a concern in the model.


                                                                                                      706