
Page 706 - ISC PROCEEDINGS 21.4
P. 706
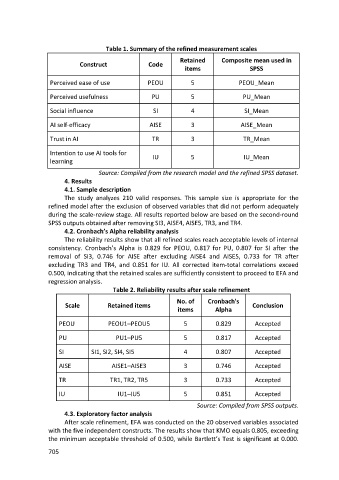
Table 1. Summary of the refined measurement scales
                                                                Retained       Composite mean used in
                             Construct               Code
                                                                  items                  SPSS

                   Perceived ease of use             PEOU           5                PEOU_Mean

                   Perceived usefulness               PU            5                 PU_Mean

                   Social influence                    SI           4                  SI_Mean

                   AI self-efficacy                   AISE          3                 AISE_Mean

                   Trust in AI                        TR            3                 TR_Mean

                   Intention to use AI tools for       IU           5                  IU_Mean
                   learning

                                    Source: Compiled from the research model and the refined SPSS dataset.
                        4. Results
                        4.1. Sample description
                        The study analyzes 210 valid responses. This sample size is appropriate for the
                  refined model after the exclusion of observed variables that did not perform adequately
                  during the scale-review stage. All results reported below are based on the second-round
                  SPSS outputs obtained after removing SI3, AISE4, AISE5, TR3, and TR4.
                        4.2. Cronbach’s Alpha reliability analysis
                        The reliability results show that all refined scales reach acceptable levels of internal
                  consistency. Cronbach’s Alpha is 0.829 for PEOU, 0.817 for PU, 0.807 for SI after the
                  removal of SI3, 0.746 for AISE after excluding AISE4 and AISE5, 0.733 for TR after
                  excluding TR3 and TR4, and 0.851 for IU. All corrected item-total correlations exceed
                  0.500, indicating that the retained scales are sufficiently consistent to proceed to EFA and
                  regression analysis.
                                         Table 2. Reliability results after scale refinement

                                                               No. of     Cronbach's
                        Scale          Retained items                                     Conclusion
                                                               items         Alpha

                      PEOU             PEOU1–PEOU5                5          0.829         Accepted

                      PU                  PU1–PU5                 5          0.817         Accepted

                      SI         SI1, SI2, SI4, SI5               4          0.807         Accepted

                      AISE              AISE1–AISE3               3          0.746         Accepted

                      TR                TR1, TR2, TR5             3          0.733         Accepted

                      IU                  IU1–IU5                 5          0.851         Accepted

                                                                      Source: Compiled from SPSS outputs.
                        4.3. Exploratory factor analysis
                        After scale refinement, EFA was conducted on the 20 observed variables associated
                  with the five independent constructs. The results show that KMO equals 0.805, exceeding
                  the minimum acceptable threshold of 0.500, while Bartlett’s Test is significant at 0.000.

                  705