
Page 516 - ISC PROCEEDINGS 21.4
P. 516
ESGit captures ESG performance
CORRUPTIONct represents country-level corruption
LN_TA, EA, EFFR, and LS denote bank size, capital adequacy, efficiency ratio, and
liability structure respectively
GDPG and INFLATION are macroeconomic controls
μᵢ captures bank-specific effects
λₜ captures time fixed effects
εᵢₜ is the idiosyncratic error term
This specification allows the analysis to estimate the relationship between ESG
performance and bank stability while controlling for bank-level characteristics and
macroeconomic conditions.
3.3. Regression methods
To ensure the reliability of the empirical findings, the study employs a sequence of
panel data estimators. The analysis begins with Pooled OLS as a baseline specification,
followed by Random Effects (RE) and Fixed Effects (FE) models to account for unobserved
bank-specific heterogeneity. An F-test confirms the presence of individual effects, while
the Hausman test indicates that the FE model is preferred, suggesting that unobserved
bank characteristics are correlated with the explanatory variables.
Subsequent diagnostic tests reveal the presence of heteroskedasticity and serial
correlation within panels. To address these issues, the primary specification adopts a
Fixed Effects model with standard errors clustered at the bank level, which provides
robust inference under both heteroskedasticity and within-bank autocorrelation. As an
additional robustness check, the Feasible Generalized Least Squares (FGLS) estimator is
applied to explicitly model cross-sectional heteroskedasticity and serial dependence. The
consistency of results across FE-clustered and FGLS estimations reinforces the robustness
and credibility of the baseline findings.
4. Empirical results and discussion
4.1. Descriptive statistics & correlation
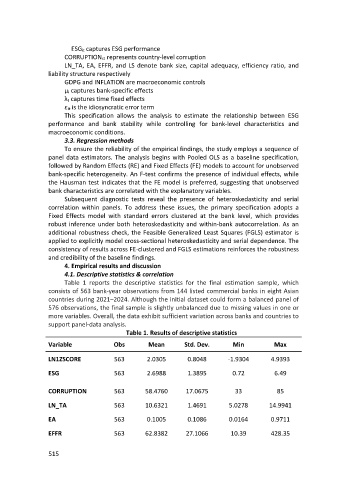
Table 1 reports the descriptive statistics for the final estimation sample, which
consists of 563 bank-year observations from 144 listed commercial banks in eight Asian
countries during 2021–2024. Although the initial dataset could form a balanced panel of
576 observations, the final sample is slightly unbalanced due to missing values in one or
more variables. Overall, the data exhibit sufficient variation across banks and countries to
support panel-data analysis.
Table 1. Results of descriptive statistics
Variable Obs Mean Std. Dev. Min Max
LN1ZSCORE 563 2.0305 0.8048 -1.9304 4.9393
ESG 563 2.6988 1.3895 0.72 6.49
CORRUPTION 563 58.4760 17.0675 33 85
LN_TA 563 10.6321 1.4691 5.0278 14.9941
EA 563 0.1005 0.1086 0.0164 0.9711
EFFR 563 62.8382 27.1066 10.39 428.35
515