
Page 505 - ISC PROCEEDINGS 21.4
P. 505
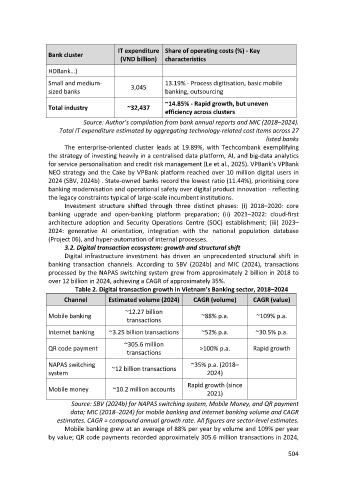
IT expenditure Share of operating costs (%) - Key
                  Bank cluster
                                           (VND billion)   characteristics
                  HDBank…)

                  Small and medium-                        13.19% - Process digitisation, basic mobile
                  sized banks                  3,045       banking, outsourcing

                                                           ~14.85% - Rapid growth, but uneven
                  Total industry              ~32,437
                                                           efficiency across clusters
                              Source: Author’s compilation from bank annual reports and MIC (2018–2024).
                      Total IT expenditure estimated by aggregating technology-related cost items across 27
                                                                                              listed banks
                        The enterprise-oriented cluster leads at 19.89%, with Techcombank exemplifying
                  the strategy of investing heavily in a centralised data platform, AI, and big-data analytics
                  for service personalisation and credit risk management (Le et al., 2025). VPBank’s VPBank
                  NEO strategy and the Cake by VPBank platform reached over 10 million digital users in
                  2024 (SBV, 2024b) . State-owned banks record the lowest ratio (11.44%), prioritising core
                  banking modernisation and operational safety over digital product innovation - reflecting
                  the legacy constraints typical of large-scale incumbent institutions.
                        Investment structure shifted through three distinct phases: (i) 2018–2020: core
                  banking upgrade and open-banking platform preparation; (ii) 2021–2022: cloud-first
                  architecture adoption and Security Operations Centre (SOC) establishment; (iii) 2023–
                  2024: generative AI orientation, integration with the national population database
                  (Project 06), and hyper-automation of internal processes.
                        3.2. Digital transaction ecosystem: growth and structural shift
                        Digital infrastructure investment has driven an unprecedented structural shift in
                  banking transaction channels. According to SBV (2024b) and MIC (2024), transactions
                  processed by the NAPAS switching system grew from approximately 2 billion in 2018 to
                  over 12 billion in 2024, achieving a CAGR of approximately 35%.
                           Table 2. Digital transaction growth in Vietnam’s Banking sector, 2018–2024

                        Channel        Estimated volume (2024)       CAGR (volume)        CAGR (value)
                                             ~12.27 billion
                  Mobile banking                                        ~88% p.a.          ~109% p.a.
                                              transactions

                  Internet banking     ~3.25 billion transactions       ~52% p.a.          ~30.5% p.a.
                                             ~305.6 million
                  QR code payment                                      >100% p.a.         Rapid growth
                                              transactions

                  NAPAS switching       ~12 billion transactions    ~35% p.a. (2018–
                  system                                                  2024)
                                                                   Rapid growth (since
                  Mobile money           ~10.2 million accounts
                                                                          2021)
                          Source: SBV (2024b) for NAPAS switching system, Mobile Money, and QR payment
                          data; MIC (2018–2024) for mobile banking and internet banking volume and CAGR
                     estimates. CAGR = compound annual growth rate. All figures are sector-level estimates.
                        Mobile banking grew at an average of 88% per year by volume and 109% per year
                  by value; QR code payments recorded approximately 305.6 million transactions in 2024,

                                                                                                      504