
Page 457 - ISC PROCEEDINGS 21.4
P. 457
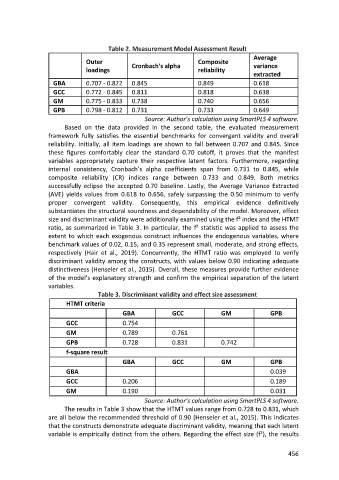
Table 2. Measurement Model Assessment Result
                                                                                          Average
                               Outer           Cronbach's alpha        Composite          variance
                               loadings                                reliability
                                                                                          extracted
                    GBA        0.707 - 0.822   0.845                   0.849              0.618
                    GCC        0.772 - 0.845   0.811                   0.818              0.638
                    GM         0.775 - 0.833   0.738                   0.740              0.656
                    GPB        0.798 - 0.812   0.731                   0.733              0.649
                                                    Source: Author’s calculation using SmartPLS 4 software.
                        Based on the data provided in the second table, the evaluated measurement
                  framework fully satisfies the essential benchmarks for convergent validity and overall
                  reliability. Initially, all item loadings are shown to fall between 0.707 and 0.845. Since
                  these figures comfortably clear the standard 0.70 cutoff, it proves that the manifest
                  variables appropriately capture their respective latent factors. Furthermore, regarding
                  internal consistency, Cronbach’s alpha coefficients span from 0.731 to 0.845, while
                  composite reliability (CR) indices range between 0.733 and 0.849. Both metrics
                  successfully eclipse the accepted 0.70 baseline. Lastly, the Average Variance Extracted
                  (AVE) yields values from 0.618 to 0.656, safely surpassing the 0.50 minimum to verify
                  proper convergent validity. Consequently, this empirical evidence definitively
                  substantiates the structural soundness and dependability of the model. Moreover, effect
                  size and discriminant validity were additionally examined using the f² index and the HTMT
                  ratio, as summarized in Table 3. In particular, the f² statistic was applied to assess the
                  extent to which each exogenous construct influences the endogenous variables, where
                  benchmark values of 0.02, 0.15, and 0.35 represent small, moderate, and strong effects,
                  respectively (Hair et al., 2019). Concurrently, the HTMT ratio was employed to verify
                  discriminant validity among the constructs, with values below 0.90 indicating adequate
                  distinctiveness (Henseler et al., 2015). Overall, these measures provide further evidence
                  of the model’s explanatory strength and confirm the empirical separation of the latent
                  variables.
                                   Table 3. Discriminant validity and effect size assessment
                        HTMT criteria
                                            GBA              GCC               GM               GPB
                        GCC                 0.754
                        GM                  0.789            0.761
                        GPB                 0.728            0.831             0.742
                        f-square result
                                            GBA              GCC               GM               GPB
                        GBA                                                                     0.039
                        GCC                 0.206                                               0.189

                        GM                  0.190                                               0.031
                                                    Source: Author’s calculation using SmartPLS 4 software.
                        The results in Table 3 show that the HTMT values range from 0.728 to 0.831, which
                  are all below the recommended threshold of 0.90 (Henseler et al., 2015). This indicates
                  that the constructs demonstrate adequate discriminant validity, meaning that each latent
                  variable is empirically distinct from the others. Regarding the effect size (f²), the results


                                                                                                      456