
Page 446 - ISC PROCEEDINGS 21.4
P. 446
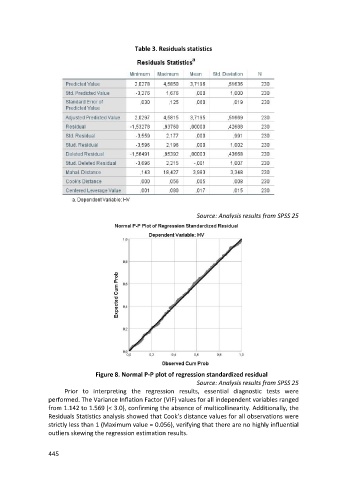
Table 3. Residuals statistics


                                                                      Source: Analysis results from SPSS 25


                                   Figure 8. Normal P-P plot of regression standardized residual
                                                                      Source: Analysis results from SPSS 25
                        Prior to interpreting the regression results, essential diagnostic tests were
                  performed. The Variance Inflation Factor (VIF) values for all independent variables ranged
                  from 1.142 to 1.569 (< 3.0), confirming the absence of multicollinearity. Additionally, the
                  Residuals Statistics analysis showed that Cook’s distance values for all observations were
                  strictly less than 1 (Maximum value = 0.056), verifying that there are no highly influential
                  outliers skewing the regression estimation results.


                  445