
Page 247 - ISC PROCEEDINGS 21.4
P. 247
The final stage involved concept connection, linking the identified themes to explain
the relationship between social media interaction and travel experience satisfaction. The
generational cohort was examined as a moderating factor influencing this relationship,
thereby providing insights into intergenerational differences in the impact of digital
interactions on travel satisfaction.
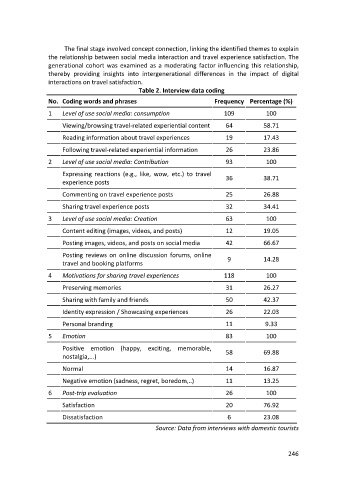
Table 2. Interview data coding
No. Coding words and phrases Frequency Percentage (%)
1 Level of use social media: consumption 109 100
Viewing/browsing travel-related experiential content 64 58.71
Reading information about travel experiences 19 17.43
Following travel-related experiential information 26 23.86
2 Level of use social media: Contribution 93 100
Expressing reactions (e.g., like, wow, etc.) to travel
experience posts 36 38.71
Commenting on travel experience posts 25 26.88
Sharing travel experience posts 32 34.41
3 Level of use social media: Creation 63 100
Content editing (images, videos, and posts) 12 19.05
Posting images, videos, and posts on social media 42 66.67
Posting reviews on online discussion forums, online 9 14.28
travel and booking platforms
4 Motivations for sharing travel experiences 118 100
Preserving memories 31 26.27
Sharing with family and friends 50 42.37
Identity expression / Showcasing experiences 26 22.03
Personal branding 11 9.33
5 Emotion 83 100
Positive emotion (happy, exciting, memorable, 58 69.88
nostalgia,...)
Normal 14 16.87
Negative emotion (sadness, regret, boredom,..) 11 13.25
6 Post-trip evaluation 26 100
Satisfaction 20 76.92
Dissatisfaction 6 23.08
Source: Data from interviews with domestic tourists
246