
Page 216 - ISC PROCEEDINGS 21.4
P. 216
3. Results and discussion
3.1. Reliability testing
Table 2. Cronbach’s Alpha test results
Latent variables Cronbach’s Alpha Corrected Item- Total Correlation
Information Quality (IQ) 0.884 0.692 - 0.745
System Quality (SyQ) 0.860 0.610 - 0.753
Service Quality (SeQ) 0.869 0.653 - 0.779
Trust in e-government (TRU) 0.903 0.708 - 0.788
Source: Research team’s synthesis, 2026
It is apparent from this table that the Cronbach’s Alpha coefficients of all the factors
satisfied the cutoff of 0.7 and every Corrected Item - Total Correlation excessed 0.3,
which were acceptable according to Robinson et al., (1991). These results suggest that all
the scales possess internal consistency.
3.2. Evaluating the relationships of independent variables
Key fit index values reached commonly accepted thresholds, including χ²/df=4.835
(≤ 5), SRMR =0.047 ≤ (0.08), even recommended thresholds such as CFI = 0.923 (≥ 0.9), TLI
= 0.905 (≥ 0.9) (Hu & Bentler, 1999). It is worth noting that regarding RMSEA, this index
reached 0.096 (> 0.08 và < 0.1) - which is mediocre acceptable (MacCallum et al., 1996).
However, Chen et al. (2008) stated that an universal cutoff for this index was unnecessary,
which confirms that the proposed research model is a good fit for the collected data.
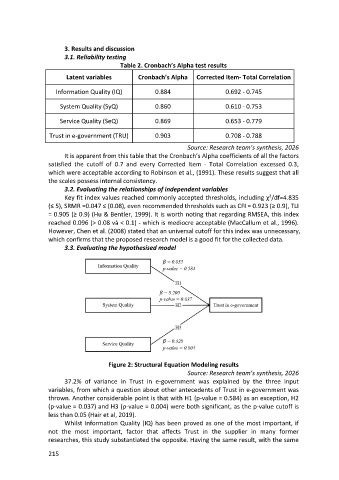
3.3. Evaluating the hypothesised model
Figure 2: Structural Equation Modeling results
Source: Research team’s synthesis, 2026
37.2% of variance in Trust in e-government was explained by the three input
variables, from which a question about other antecedents of Trust in e-government was
thrown. Another considerable point is that with H1 (p-value = 0.584) as an exception, H2
(p-value = 0.037) and H3 (p-value = 0.004) were both significant, as the p-value cutoff is
less than 0.05 (Hair et al, 2019).
Whilst Information Quality (IQ) has been proved as one of the most important, if
not the most important, factor that affects Trust in the supplier in many former
researches, this study substantiated the opposite. Having the same result, with the same
215