
Page 215 - ISC PROCEEDINGS 21.4
P. 215
Data collected were analyzed and processed using Microsoft Excel 2016, SPSS 26.0,
and AMOS 20.0 in accordance with a number of rigorous steps to establish the research
model’s reliability and validity. First, Cronbach’s Alpha was calculated for each
measurement scale to analyze the degree to which the observed variables representing
the same constructs were closely aligned with one another. Secondly, the measurement
model was validated using Confirmatory Factor Analysis (CFA) by testing the goodness-of-
fit of the empirical data to the theoretical model, the structural model was examined
through Structural Equation Modeling (SEM) in order to analyze the directional
relationships between the variable(s). In this analysis, the standardized coefficient (β)
indicates the magnitude of the independent variable’s effect on the dependent variable,
and the p-value indicates the statistical significance of the respective relationship of the
variable(s).
Descriptive Statistics of the Study Sample
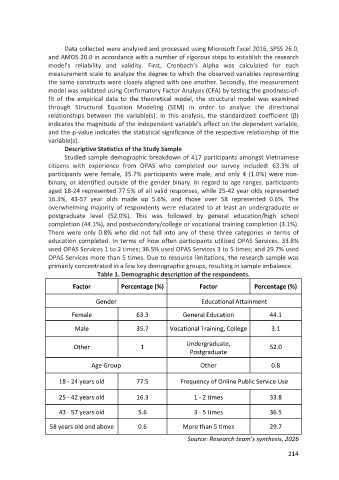
Studied sample demographic breakdown of 417 participants amongst Vietnamese
citizens with experience from OPAS who completed our survey included: 63.3% of
participants were female, 35.7% participants were male, and only 4 (1.0%) were non-
binary, or identified outside of the gender binary. In regard to age ranges, participants
aged 18-24 represented 77.5% of all valid responses, while 25-42 year olds represented
16.3%, 43-57 year olds made up 5.6%, and those over 58 represented 0.6%. The
overwhelming majority of respondents were educated to at least an undergraduate or
postgraduate level (52.0%). This was followed by general education/high school
completion (44.1%), and postsecondary/college or vocational training completion (3.1%).
There were only 0.8% who did not fall into any of these three categories in terms of
education completed. In terms of how often participants utilized OPAS Services, 33.8%
used OPAS Services 1 to 2 times; 36.5% used OPAS Services 3 to 5 times; and 29.7% used
OPAS Services more than 5 times. Due to resource limitations, the research sample was
primarily concentrated in a few key demographic groups, resulting in sample imbalance.
Table 1. Demographic description of the respondents.
Factor Percentage (%) Factor Percentage (%)
Gender Educational Attainment
Female 63.3 General Education 44.1
Male 35.7 Vocational Training, College 3.1
Other 1 Undergraduate, 52.0
Postgraduate
Age Group Other 0.8
18 - 24 years old 77.5 Frequency of Online Public Service Use
25 - 42 years old 16.3 1 - 2 times 33.8
43 - 57 years old 5.6 3 - 5 times 36.5
58 years old and above 0.6 More than 5 times 29.7
Source: Research team’s synthesis, 2026
214