
Page 356 - Ebook HTKH 2024
P. 356
The collected primary data were processed using SPSS and AMOS software. The
study tested the reliability of the scales using Cronbach’s Alpha > 0.7, a statistical
measure indicating the degree of internal consistency among the items in the scale.
Subsequently, an Exploratory Factor Analysis (EFA) was performed to assess the
unidimensionality of the scales used in the study. Following this, Confirmatory Factor
Analysis (CFA) was utilized to validate the scales. Finally, the study employed
Structural Equation Modeling (SEM) to test the fit of the theoretical model and the
hypotheses.
4. Research results
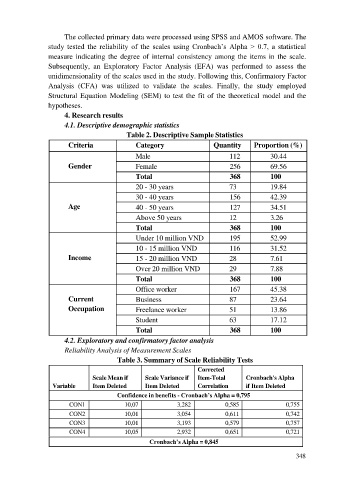
4.1. Descriptive demographic statistics
Table 2. Descriptive Sample Statistics
Criteria Category Quantity Proportion (%)
Male 112 30.44
Gender Female 256 69.56
Total 368 100
20 - 30 years 73 19.84
30 - 40 years 156 42.39
Age 40 - 50 years 127 34.51
Above 50 years 12 3.26
Total 368 100
Under 10 million VND 195 52.99
10 - 15 million VND 116 31.52
Income 15 - 20 million VND 28 7.61
Over 20 million VND 29 7.88
Total 368 100
Office worker 167 45.38
Current Business 87 23.64
Occupation Freelance worker 51 13.86
Student 63 17.12
Total 368 100
4.2. Exploratory and confirmatory factor analysis
Reliability Analysis of Measurement Scales
Table 3. Summary of Scale Reliability Tests
Corrected
Scale Mean if Scale Variance if Item-Total Cronbach's Alpha
Variable Item Deleted Item Deleted Correlation if Item Deleted
Confidence in benefits - Cronbach’s Alpha = 0,795
CON1 10,07 3,282 0,585 0,755
CON2 10,01 3,054 0,611 0,742
CON3 10,01 3,193 0,579 0,757
CON4 10,05 2,932 0,651 0,721
Cronbach’s Alpha = 0,845
348