
Page 360 - Ebook HTKH 2024
P. 360
Through Confirmatory Factor Analysis (CFA), the measurement model fits well
with the actual data.
Structural Equation Modeling (SEM)
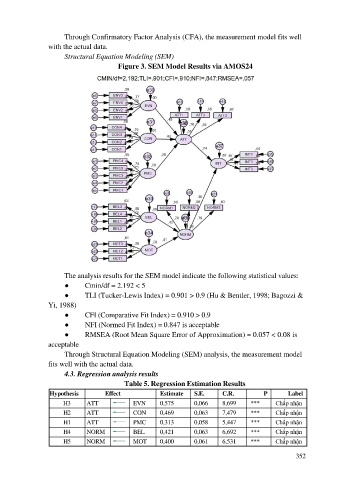
Figure 3. SEM Model Results via AMOS24
The analysis results for the SEM model indicate the following statistical values:
● Cmin/df = 2.192 < 5
● TLI (Tucker-Lewis Index) = 0.901 > 0.9 (Hu & Bentler, 1998; Bagozzi &
Yi, 1988)
● CFI (Comparative Fit Index) = 0.910 > 0.9
● NFI (Normed Fit Index) = 0.847 is acceptable
● RMSEA (Root Mean Square Error of Approximation) = 0.057 < 0.08 is
acceptable
Through Structural Equation Modeling (SEM) analysis, the measurement model
fits well with the actual data.
4.3. Regression analysis results
Table 5. Regression Estimation Results
Hypothesis Effect Estimate S.E. C.R. P Label
H3 ATT EVN 0,575 0,066 8,699 *** Chấp nhận
H2 ATT CON 0,469 0,063 7,479 *** Chấp nhận
H1 ATT PMC 0,313 0,058 5,447 *** Chấp nhận
H4 NORM BEL 0,421 0,063 6,692 *** Chấp nhận
H5 NORM MOT 0,400 0,061 6,531 *** Chấp nhận
352