
Page 111 - Ebook HTKH 2024
P. 111
The research uses data sets collected from financial statements and annual reports
for 2014 - 2023. However, some banks could have publicly provided complete data
during collection. So, the authors only collected data through 20 commercial banks in
Vietnam to conduct research. At the same time, variables belonging to the group of
macro factors such as GDP economic growth, inflation rate, and CO2 emissions were
measured through secondary data sets collected from independent official entities,
reputable in the period 2014 - 2023, for example, World Bank Climate Watch.
In order to estimate the model, we found the system-GMM dynamic panel
estimator is a method compiled of first-differences instrumented on lagged levels and
on the ground that it provides a scrupulous cure for endogeneity bias (Blundell & Bond,
1998). In addition, it also holds two measurement errors; the GMM dynamic panel
estimator is more robust. Second, if we adequately lagged the instrumental variables,
this estimator remains steady. Therefore, we employ the two-step estimator as
(Semykina & Wooldridge, 2010) stated that it solves the problems of heteroscedasticity,
the autocorrelation of errors, simultaneity bias, and measurement mistakes. To test the
validity of the instruments, we use the Hansen test of overidentifying restrictions
(Hansen, 1982) with a null hypothesis that there is no correlation between instrumental
variables and residual. We also use the Arellano-Bond (AR) test with a null
hypothesis that there is no second-order autocorrelation.
4. Research results and discussions
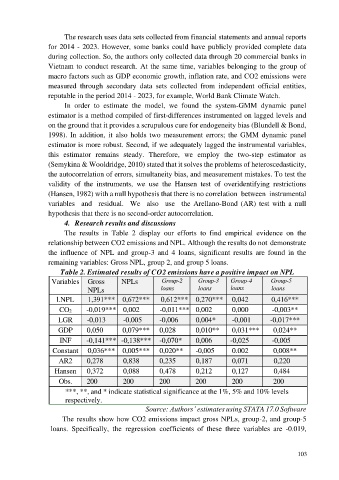
The results in Table 2 display our efforts to find empirical evidence on the
relationship between CO2 emissions and NPL. Although the results do not demonstrate
the influence of NPL and group-3 and 4 loans, significant results are found in the
remaining variables: Gross NPL, group 2, and group 5 loans.
Table 2. Estimated results of CO2 emissions have a positive impact on NPL
Variables Gross NPLs Group-2 Group-3 Group-4 Group-5
NPLs loans loans loans loans
l.NPL 1,391*** 0,672*** 0,612*** 0,270*** 0,042 0,416***
CO2 -0,019*** 0,002 -0,011*** 0,002 0,000 -0,003**
LGR -0,013 -0,005 -0,006 0,004* -0,001 -0,017***
GDP 0,050 0,079*** 0,028 0,010** 0,031*** 0,024**
INF -0,141*** -0,138*** -0,070* 0,006 -0,025 -0,005
Constant 0,036*** 0,005*** 0,020** -0,005 0.002 0,008**
AR2 0,278 0,838 0,235 0,187 0,071 0,220
Hansen 0,372 0,088 0,478 0,212 0,127 0,484
Obs. 200 200 200 200 200 200
***, **, and * indicate statistical significance at the 1%, 5% and 10% levels
respectively.
Source: Authors’ estimates using STATA 17.0 Software
The results show how CO2 emissions impact gross NPLs, group-2, and group-5
loans. Specifically, the regression coefficients of these three variables are -0.019,
103