
Page 696 - ISC PROCEEDINGS 21.4
P. 696
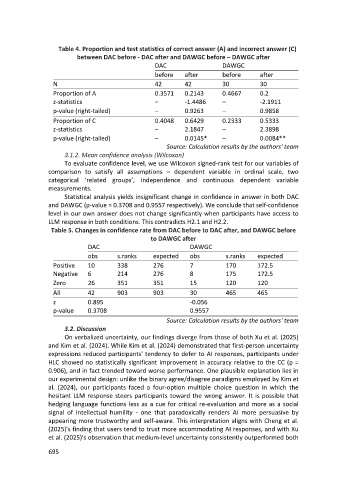
Table 4. Proportion and test statistics of correct answer (A) and incorrect answer (C)
                            between DAC before - DAC after and DAWGC before – DAWGC after
                                                       DAC                     DAWGC
                                                       before     after        before       after
                    N                                  42         42           30           30
                    Proportion of A                    0.3571     0.2143       0.4667       0.2
                    z-statistics                       –          -1.4486      –            -2.1911
                    p-value (right-tailed)             –          0.9263       –            0.9858
                    Proportion of C                    0.4048     0.6429       0.2333       0.5333
                    z-statistics                       –          2.1847       –            2.3898
                    p-value (right-tailed)             –          0.0145*      –            0.0084**
                                                            Source: Calculation results by the authors' team
                        3.1.2. Mean confidence analysis (Wilcoxon)
                        To evaluate confidence level, we use Wilcoxon signed-rank test for our variables of
                  comparison to satisfy all assumptions – dependent variable in ordinal scale, two
                  categorical ‘related groups’, independence and continuous dependent variable
                  measurements.
                        Statistical analysis yields insignificant change in confidence in answer in both DAC
                  and DAWGC (p-value = 0.3708 and 0.9557 respectively). We conclude that self-confidence
                  level in our own answer does not change significantly when participants have access to
                  LLM response in both conditions. This contradicts H2.1 and H2.2.
                   Table 5. Changes in confidence rate from DAC before to DAC after, and DAWGC before
                                                      to DAWGC after
                                DAC                                 DAWGC
                                obs       s.ranks      expected     obs         s.ranks    expected
                    Positive    10        338          276          7           170        172.5
                    Negative    6         214          276          8           175        172.5
                    Zero        26        351          351          15          120        120
                    All         42        903          903          30          465        465
                    z           0.895                               -0.056
                    p-value     0.3708                              0.9557
                                                            Source: Calculation results by the authors' team
                        3.2. Discussion
                        On verbalized uncertainty, our findings diverge from those of both Xu et al. (2025)
                  and Kim et al. (2024). While Kim et al. (2024) demonstrated that first-person uncertainty
                  expressions reduced participants' tendency to defer to AI responses, participants under
                  HLC showed no statistically significant improvement in accuracy relative to the CC (p =
                  0.906), and in fact trended toward worse performance. One plausible explanation lies in
                  our experimental design: unlike the binary agree/disagree paradigms employed by Kim et
                  al. (2024), our participants faced a four-option multiple choice question in which the
                  hesitant LLM response steers participants toward the wrong answer. It is possible that
                  hedging language functions less as a cue for critical re-evaluation and more as a social
                  signal of intellectual humility - one that paradoxically renders AI more persuasive by
                  appearing more trustworthy and self-aware. This interpretation aligns with Cheng et al.
                  (2025)'s finding that users tend to trust more accommodating AI responses, and with Xu
                  et al. (2025)'s observation that medium-level uncertainty consistently outperformed both

                  695