
Page 695 - ISC PROCEEDINGS 21.4
P. 695
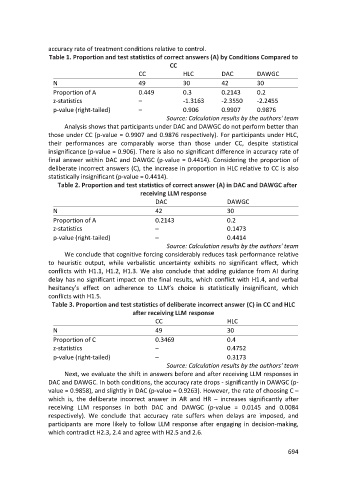
accuracy rate of treatment conditions relative to control.
                  Table 1. Proportion and test statistics of correct answers (A) by Conditions Compared to
                                                             CC
                                                  CC             HLC           DAC         DAWGC
                    N                             49             30            42          30
                    Proportion of A               0.449          0.3           0.2143      0.2
                    z-statistics                  –              -1.3163       -2.3550     -2.2455
                    p-value (right-tailed)        –              0.906         0.9907      0.9876
                                                            Source: Calculation results by the authors' team
                        Analysis shows that participants under DAC and DAWGC do not perform better than
                  those under CC (p-value = 0.9907 and 0.9876 respectively). For participants under HLC,
                  their performances are comparably worse than those under CC, despite statistical
                  insignificance (p-value = 0.906). There is also no significant difference in accuracy rate of
                  final answer within DAC and DAWGC (p-value = 0.4414). Considering the proportion of
                  deliberate incorrect answers (C), the increase in proportion in HLC relative to CC is also
                  statistically insignificant (p-value = 0.4414).
                     Table 2. Proportion and test statistics of correct answer (A) in DAC and DAWGC after
                                                  receiving LLM response
                                                        DAC                      DAWGC
                    N                                   42                       30
                    Proportion of A                     0.2143                   0.2
                    z-statistics                        –                        0.1473
                    p-value (right-tailed)              –                        0.4414
                                                            Source: Calculation results by the authors' team
                        We conclude that cognitive forcing considerably reduces task performance relative
                  to heuristic output, while verbalistic uncertainty exhibits no significant effect, which
                  conflicts with H1.1, H1.2, H1.3. We also conclude that adding guidance from AI during
                  delay has no significant impact on the final results, which conflict with H1.4, and verbal
                  hesitancy’s effect on adherence to LLM’s choice is statistically insignificant, which
                  conflicts with H1.5.
                   Table 3. Proportion and test statistics of deliberate incorrect answer (C) in CC and HLC
                                                after receiving LLM response
                                                        CC                       HLC
                    N                                   49                       30
                    Proportion of C                     0.3469                   0.4
                    z-statistics                        –                        0.4752
                    p-value (right-tailed)              –                        0.3173
                                                            Source: Calculation results by the authors' team
                        Next, we evaluate the shift in answers before and after receiving LLM responses in
                  DAC and DAWGC. In both conditions, the accuracy rate drops - significantly in DAWGC (p-
                  value = 0.9858), and slightly in DAC (p-value = 0.9263). However, the rate of choosing C –
                  which is, the deliberate incorrect answer in AR and HR – increases significantly after
                  receiving LLM responses in both DAC and DAWGC (p-value = 0.0145 and 0.0084
                  respectively). We conclude that accuracy rate suffers when delays are imposed, and
                  participants are more likely to follow LLM response after engaging in decision-making,
                  which contradict H2.3, 2.4 and agree with H2.5 and 2.6.


                                                                                                      694