
Page 581 - ISC PROCEEDINGS 21.4
P. 581
All observed variables have Factor Loading coefficients greater than 0.5 (0.766 -
0.799). This indicates that the EFA model is appropriate.
Hypothesis testing
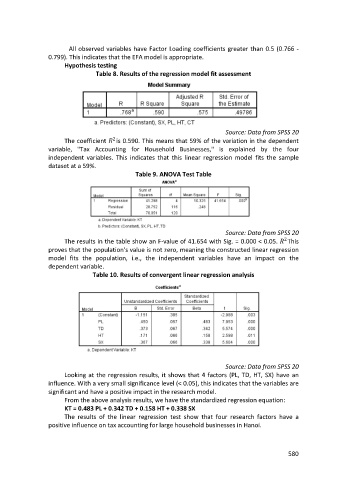
Table 8. Results of the regression model fit assessment
Source: Data from SPSS 20
The coefficient is 0.590. This means that 59% of the variation in the dependent
2
variable, "Tax Accounting for Household Businesses," is explained by the four
independent variables. This indicates that this linear regression model fits the sample
dataset at a 59%.
Table 9. ANOVA Test Table
Source: Data from SPSS 20
The results in the table show an F-value of 41.654 with Sig. = 0.000 < 0.05. This
2
proves that the population's value is not zero, meaning the constructed linear regression
model fits the population, i.e., the independent variables have an impact on the
dependent variable.
Table 10. Results of convergent linear regression analysis
Source: Data from SPSS 20
Looking at the regression results, it shows that 4 factors (PL, TD, HT, SX) have an
influence. With a very small significance level (< 0.05), this indicates that the variables are
significant and have a positive impact in the research model.
From the above analysis results, we have the standardized regression equation:
KT = 0.483 PL + 0.342 TD + 0.158 HT + 0.338 SX
The results of the linear regression test show that four research factors have a
positive influence on tax accounting for large household businesses in Hanoi.
580