
Page 580 - ISC PROCEEDINGS 21.4
P. 580
The Exploratory Factor Analysis (EFA) rotated matrix shows that the results
effectively represent the important values of convergent and discriminant validity. The
observed variables converge to the same factor as initially observed, indicating that the
results satisfy the convergent validity requirement. Furthermore, the observed variables
belong to each factor and are clearly distinct from other factors, meaning that
discriminant validity is ensured.
Factor analysis with dependent variable
After running the model, to perform exploratory factor analysis (EFA) on the
dependent variable, we have the following table:
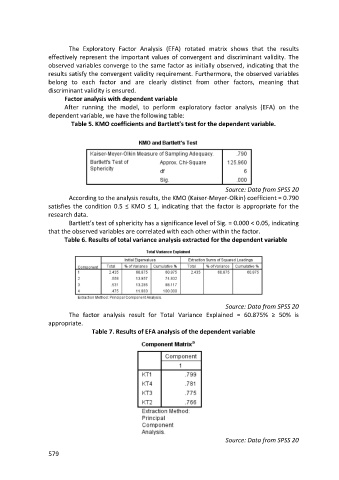
Table 5. KMO coefficients and Bartlett's test for the dependent variable.
Source: Data from SPSS 20
According to the analysis results, the KMO (Kaiser-Meyer-Olkin) coefficient = 0.790
satisfies the condition 0.5 ≤ KMO ≤ 1, indicating that the factor is appropriate for the
research data.
Bartlett's test of sphericity has a significance level of Sig. = 0.000 < 0.05, indicating
that the observed variables are correlated with each other within the factor.
Table 6. Results of total variance analysis extracted for the dependent variable
Source: Data from SPSS 20
The factor analysis result for Total Variance Explained = 60.875% ≥ 50% is
appropriate.
Table 7. Results of EFA analysis of the dependent variable
Source: Data from SPSS 20
579