
Page 579 - ISC PROCEEDINGS 21.4
P. 579
The above results show that the coefficient 0.5 ≤ KMO = 0.717 ≤ 1, and factor
analysis is acceptable for the research dataset.
Bartlett's test of sphericity has a significance level of Sig. = 0.000 < 0.05, indicating
that the observed variables are correlated with each other within the factor.
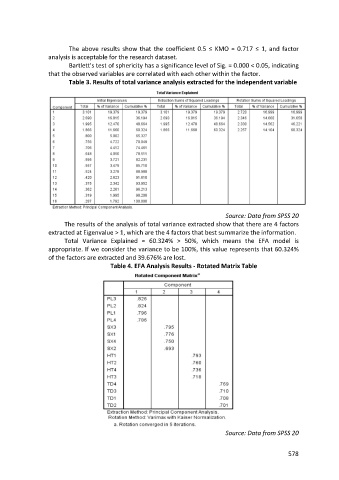
Table 3. Results of total variance analysis extracted for the independent variable
Source: Data from SPSS 20
The results of the analysis of total variance extracted show that there are 4 factors
extracted at Eigenvalue > 1, which are the 4 factors that best summarize the information.
Total Variance Explained = 60.324% > 50%, which means the EFA model is
appropriate. If we consider the variance to be 100%, this value represents that 60.324%
of the factors are extracted and 39.676% are lost.
Table 4. EFA Analysis Results - Rotated Matrix Table
Source: Data from SPSS 20
578