


Page 50 - ISC PROCEEDINGS 21.4
P. 50
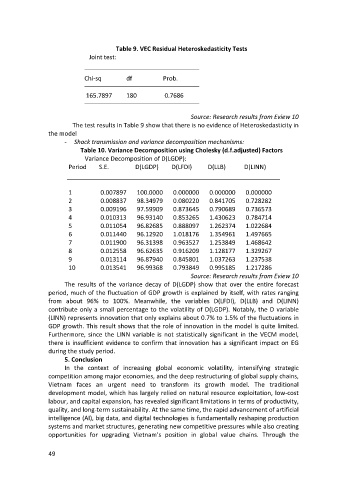
Table 9. VEC Residual Heteroskedasticity Tests
                                Joint test:


                               Chi-sq        df           Prob.


                               165.7897      180           0.7686


                                                                    Source: Research results from Eview 10
                           The test results in Table 9 show that there is no evidence of Heteroskedasticity in
                  the model
                        -  Shock transmission and variance decomposition mechanisms:
                             Table 10. Variance Decomposition using Cholesky (d.f.adjusted) Factors
                               Variance Decomposition of D(LGDP):
                         Period     S.E.         D(LGDP)     D(LFDI)      D(LLB)       D(LINN)


                         1          0.007897     100.0000     0.000000     0.000000    0.000000
                         2          0.008837     98.34979     0.080220     0.841705    0.728282
                         3          0.009196     97.59909     0.873645     0.790689    0.736573
                         4          0.010313     96.93140     0.853265     1.430623    0.784714
                         5          0.011054     96.82685     0.888097     1.262374    1.022684
                         6          0.011440     96.12920     1.018176     1.354961    1.497665
                         7          0.011900     96.31398     0.963527     1.253849    1.468642
                         8          0.012558     96.62635     0.916209     1.128177    1.329267
                         9          0.013114     96.87940     0.845801     1.037263    1.237538
                         10         0.013541     96.99368     0.793849     0.995185    1.217286
                                                                    Source: Research results from Eview 10
                        The results of the variance decay of D(LGDP) show that over the entire forecast
                  period, much of the fluctuation of GDP growth is explained by itself, with rates ranging
                  from about 96% to 100%. Meanwhile, the variables D(LFDI), D(LLB) and D(LINN)
                  contribute only a small percentage to the volatility of D(LGDP). Notably, the D variable
                  (LINN) represents innovation that only explains about 0.7% to 1.5% of the fluctuations in
                  GDP growth. This result shows that the role of innovation in the model is quite limited.
                  Furthermore, since the LINN variable is not statistically significant in the VECM model,
                  there is insufficient evidence to confirm that innovation has a significant impact on EG
                  during the study period.
                        5. Conclusion
                        In the context of increasing global economic volatility, intensifying strategic
                  competition among major economies, and the deep restructuring of global supply chains,
                  Vietnam faces an urgent need to transform its growth model. The traditional
                  development model, which has largely relied on natural resource exploitation, low-cost
                  labour, and capital expansion, has revealed significant limitations in terms of productivity,
                  quality, and long-term sustainability. At the same time, the rapid advancement of artificial
                  intelligence (AI), big data, and digital technologies is fundamentally reshaping production
                  systems and market structures, generating new competitive pressures while also creating
                  opportunities for upgrading Vietnam’s position in global value chains. Through the


                  49

