


Page 46 - ISC PROCEEDINGS 21.4
P. 46
4. Results and discussion
                        4.1. Descriptive statistics
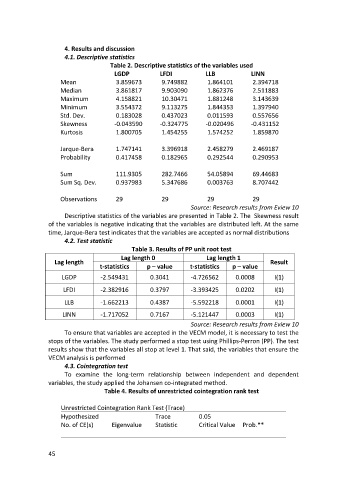
                                        Table 2. Descriptive statistics of the variables used
                                         LGDP            LFDI            LLB             LINN
                      Mean                3.859673        9.749882        1.864101        2.394718
                      Median              3.861817        9.903090        1.862376        2.511883
                      Maximum             4.158821        10.30471        1.881248        3.143639
                      Minimum             3.554372        9.113275        1.844353        1.397940
                      Std. Dev.           0.183028        0.437023        0.011593        0.557656
                      Skewness           -0.043590       -0.324775       -0.020496       -0.431152
                      Kurtosis            1.800705        1.454255        1.574252        1.859870


                      Jarque-Bera         1.747141        3.396918        2.458279        2.469187
                      Probability         0.417458        0.182965        0.292544        0.290953


                      Sum                 111.9305        282.7466        54.05894        69.44683
                      Sum Sq. Dev.        0.937983        5.347686        0.003763        8.707442


                      Observations        29              29              29              29
                                                                    Source: Research results from Eview 10
                        Descriptive statistics of the variables are presented in Table 2. The Skewness result
                  of the variables is negative indicating that the variables are distributed left. At the same
                  time, Jarque-Bera test indicates that the variables are accepted as normal distributions
                        4.2. Test statistic
                                               Table 3. Results of PP unit root test
                                            Lag length 0                  Lag length 1
                    Lag length                                                                  Result
                                    t-statistics     p – value      t-statistics   p – value

                       LGDP         -2.549431         0.3041        -4.726562       0.0008       I(1)
                       LFDI         -2.382916         0.3797        -3.393425       0.0202       I(1)

                        LLB         -1.662213         0.4387        -5.592218       0.0001       I(1)

                       LINN         -1.717052         0.7167        -5.121447       0.0003       I(1)
                                                                    Source: Research results from Eview 10
                        To ensure that variables are accepted in the VECM model, it is necessary to test the
                  stops of the variables. The study performed a stop test using Phillips-Perron (PP). The test
                  results show that the variables all stop at level 1. That said, the variables that ensure the
                  VECM analysis is performed
                        4.3. Cointegration test
                        To examine the long-term relationship between independent and dependent
                  variables, the study applied the Johansen co-integrated method.
                                      Table 4. Results of unrestricted cointegration rank test

                      Unrestricted Cointegration Rank Test (Trace)
                      Hypothesized                      Trace          0.05
                      No. of CE(s)      Eigenvalue      Statistic      Critical Value  Prob.**


                  45

