


Page 47 - ISC PROCEEDINGS 21.4
P. 47
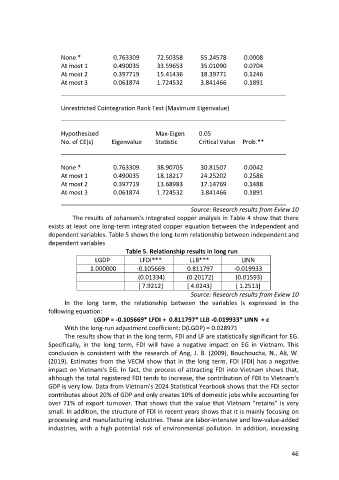
None *             0.763309       72.50358       55.24578        0.0008
                      At most 1          0.490035       33.59653       35.01090        0.0704
                      At most 2          0.397719       15.41436       18.39771        0.1246
                      At most 3          0.061874       1.724532       3.841466        0.1891


                      Unrestricted Cointegration Rank Test (Maximum Eigenvalue)


                      Hypothesized                      Max-Eigen      0.05
                      No. of CE(s)      Eigenvalue      Statistic      Critical Value  Prob.**


                      None *             0.763309       38.90705       30.81507        0.0042
                      At most 1          0.490035       18.18217       24.25202        0.2586
                      At most 2          0.397719       13.68983       17.14769        0.1488
                      At most 3          0.061874       1.724532       3.841466        0.1891


                                                                    Source: Research results from Eview 10
                           The results of Johansen's integrated copper analysis in Table 4 show that there
                  exists at least one long-term integrated copper equation between the independent and
                  dependent variables. Table 5 shows the long-term relationship between independent and
                  dependent variables
                                             Table 5. Relationship results in long run
                                  LGDP            LFDI***           LLB***            LINN
                                 1.000000        -0.105669         0.811797        -0.019933
                                                  (0.01334)        (0.20172)        (0.01593)
                                                  [ 7.9212]        [ 4.0243]        [ 1.2513]
                                                                    Source: Research results from Eview 10
                        In the long term, the relationship between the variables is expressed in the
                  following equation:
                                  LGDP = -0.105669* LFDI + 0.811797* LLB -0.019933* LINN + ε
                        With the long-run adjustment coefficient: D(LGDP) = 0.028971
                        The results show that in the long term, FDI and LF are statistically significant for EG.
                  Specifically, in the long term, FDI will have a negative impact on EG in Vietnam. This
                  conclusion is consistent with the research of Ang, J. B. (2009), Bouchoucha, N., Ali, W.
                  (2019). Estimates from the VECM show that in the long term, FDI (FDI) has a negative
                  impact on Vietnam's EG. In fact, the process of attracting FDI into Vietnam shows that,
                  although the total registered FDI tends to increase, the contribution of FDI to Vietnam's
                  GDP is very low. Data from Vietnam's 2024 Statistical Yearbook shows that the FDI sector
                  contributes about 20% of GDP and only creates 10% of domestic jobs while accounting for
                  over 71% of export turnover. That shows that the value that Vietnam "retains" is very
                  small. In addition, the structure of FDI in recent years shows that it is mainly focusing on
                  processing and manufacturing industries. These are labor-intensive and low-value-added
                  industries, with a high potential risk of environmental pollution. In addition, increasing


                                                                                                       46

