
Page 484 - ISC PROCEEDINGS 21.4
P. 484
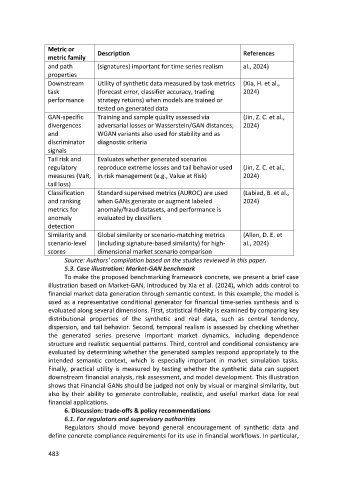
Metric or        Description                                        References
                  metric family
                  and path         (signatures) important for time series realism     al., 2024)
                  properties
                  Downstream       Utility of synthetic data measured by task metrics  (Xia, H. et al.,
                  task             (forecast error, classifier accuracy, trading      2024)
                  performance      strategy returns) when models are trained or
                                   tested on generated data
                  GAN-specific     Training and sample quality assessed via           (Jin, Z. C. et al.,
                  divergences      adversarial losses or Wasserstein/GAN distances;   2024)
                  and              WGAN variants also used for stability and as
                  discriminator    diagnostic criteria
                  signals
                  Tail risk and    Evaluates whether generated scenarios
                  regulatory       reproduce extreme losses and tail behavior used    (Jin, Z. C. et al.,
                  measures (VaR, in risk management (e.g., Value at Risk)             2024)
                  tail loss)
                  Classification   Standard supervised metrics (AUROC) are used       (Labiad, B. et al.,
                  and ranking      when GANs generate or augment labeled              2024)
                  metrics for      anomaly/fraud datasets, and performance is
                  anomaly          evaluated by classifiers
                  detection
                  Similarity and   Global similarity or scenario-matching metrics     (Allen, D. E. et
                  scenario-level   (including signature-based similarity) for high-   al., 2024)
                  scores           dimensional market scenario comparison
                        Source: Authors' compilation based on the studies reviewed in this paper.
                        5.3. Case illustration: Market-GAN benchmark
                        To make the proposed benchmarking framework concrete, we present a brief case
                  illustration based on Market-GAN, introduced by Xia et al. (2024), which adds control to
                  financial market data generation through semantic context. In this example, the model is
                  used as a representative conditional generator for financial time-series synthesis and is
                  evaluated along several dimensions. First, statistical fidelity is examined by comparing key
                  distributional properties of the synthetic and real data, such as central tendency,
                  dispersion, and tail behavior. Second, temporal realism is assessed by checking whether
                  the generated series preserve important market dynamics, including dependence
                  structure and realistic sequential patterns. Third, control and conditional consistency are
                  evaluated by determining whether the generated samples respond appropriately to the
                  intended semantic context, which is especially important in market simulation tasks.
                  Finally, practical utility is measured by testing whether the synthetic data can support
                  downstream financial analysis, risk assessment, and model development. This illustration
                  shows that Financial GANs should be judged not only by visual or marginal similarity, but
                  also by their ability to generate controllable, realistic, and useful market data for real
                  financial applications.
                        6. Discussion: trade-offs & policy recommendations
                        6.1. For regulators and supervisory authorities
                        Regulators should move beyond general encouragement of synthetic data and
                  define concrete compliance requirements for its use in financial workflows. In particular,


                  483