
Page 483 - ISC PROCEEDINGS 21.4
P. 483
Operational suitability for infrastructure: can the generator be measured, versioned,
served, and audited inside production pipelines used by firms and supervisors.
The subsections below summarize most common datasets and task-oriented metric
suites that together form a repeatable benchmarking recipe for infrastructure-grade
Financial GANs.
5.1. Datasets
Choose datasets that match the target task (market simulation, fraud detection,
limit-order realism, scenario generation). For infrastructure work, prefer datasets that are
accompanied by clear provenance and schema metadata so results are reproducible and
auditable.
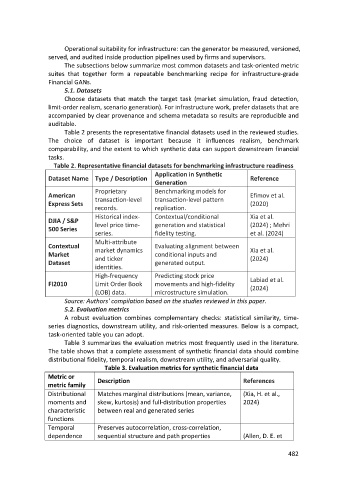
Table 2 presents the representative financial datasets used in the reviewed studies.
The choice of dataset is important because it influences realism, benchmark
comparability, and the extent to which synthetic data can support downstream financial
tasks.
Table 2. Representative financial datasets for benchmarking infrastructure readiness
Application in Synthetic
Dataset Name Type / Description Reference
Generation
Proprietary Benchmarking models for
American transaction-level transaction-level pattern Efimov et al.
Express Sets (2020)
records. replication.
Historical index- Contextual/conditional Xia et al.
DJIA / S&P
500 Series level price time- generation and statistical (2024) ; Mehri
series. fidelity testing. et al. (2024)
Multi-attribute
Contextual market dynamics Evaluating alignment between Xia et al.
Market and ticker conditional inputs and (2024)
Dataset generated output.
identities.
High-frequency Predicting stock price
FI2010 Limit Order Book movements and high-fidelity Labiad et al.
(LOB) data. microstructure simulation. (2024)
Source: Authors' compilation based on the studies reviewed in this paper.
5.2. Evaluation metrics
A robust evaluation combines complementary checks: statistical similarity, time-
series diagnostics, downstream utility, and risk-oriented measures. Below is a compact,
task-oriented table you can adopt.
Table 3 summarizes the evaluation metrics most frequently used in the literature.
The table shows that a complete assessment of synthetic financial data should combine
distributional fidelity, temporal realism, downstream utility, and adversarial quality.
Table 3. Evaluation metrics for synthetic financial data
Metric or Description References
metric family
Distributional Matches marginal distributions (mean, variance, (Xia, H. et al.,
moments and skew, kurtosis) and full-distribution properties 2024)
characteristic between real and generated series
functions
Temporal Preserves autocorrelation, cross-correlation,
dependence sequential structure and path properties (Allen, D. E. et
482