
Page 129 - ISC PROCEEDINGS 21.4
P. 129
Score Differences from Differences from
(ranging from low compliance Asia-Pacific subregional
Index score
costs (zero value), to high average average
compliance costs (one value)) compliance costs compliance costs
Foreign direct
investment 0.49 -1% -24%
Intellectual
property 0.00 -100% -100%
rights
Telecommuni
cation
regulations 0.43 -10% -14%
and
competition
Cross-border
data policies 0.17 -44% -40%
Domestic
data 0.38 -10% -9%
protection
and privacy
Internet
intermediary 0.38 -30% -33%
liability
Content 0.54 28% -7%
access
Non-technical
measures 0.63 75% 24%
(NTMs)
Standards
and 0.25 12% -11%
procedures
Online sales
and 0.07 -68% -77%
transactions
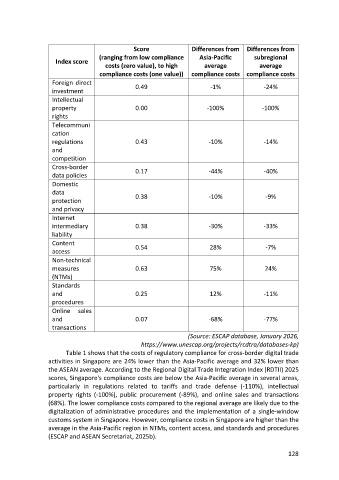
(Source: ESCAP database, January 2026,
https://www.unescap.org/projects/rcdtra/databases-kp)
Table 1 shows that the costs of regulatory compliance for cross-border digital trade
activities in Singapore are 24% lower than the Asia-Pacific average and 32% lower than
the ASEAN average. According to the Regional Digital Trade Integration Index (RDTII) 2025
scores, Singapore's compliance costs are below the Asia-Pacific average in several areas,
particularly in regulations related to tariffs and trade defense (-110%), intellectual
property rights (-100%), public procurement (-89%), and online sales and transactions
(68%). The lower compliance costs compared to the regional average are likely due to the
digitalization of administrative procedures and the implementation of a single-window
customs system in Singapore. However, compliance costs in Singapore are higher than the
average in the Asia-Pacific region in NTMs, content access, and standards and procedures
(ESCAP and ASEAN Secretariat, 2025b).
128