
Page 214 - Demo
P. 214
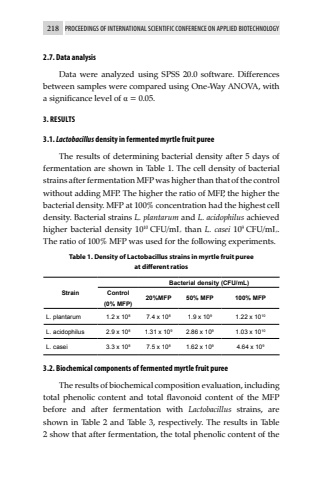
218 PROCEEDINGS OF INTERNATIONAL SCIENTIFIC CONFERENCE ON APPLIED BIOTECHNOLOGY2.7. Data analysisData were analyzed using SPSS 20.0 software. Differences between samples were compared using One-Way ANOVA, with a significance level of %u03b1 = 0.05.3. RESULTS3.1. Lactobacillus density in fermented myrtle fruit pureeThe results of determining bacterial density after 5 days of fermentation are shown in Table 1. The cell density of bacterial strains after fermentation MFP was higher than that of the control without adding MFP. The higher the ratio of MFP, the higher the bacterial density. MFP at 100% concentration had the highest cell density. Bacterial strains L. plantarum and L. acidophilus achieved higher bacterial density 1010 CFU/mL than L. casei 109 CFU/mL. The ratio of 100% MFP was used for the following experiments.Table 1. Density of Lactobacillus strains in myrtle fruit puree at different ratiosStrainBacterial density (CFU/mL)Control (0% MFP) 20%MFP 50% MFP 100% MFPL. plantarum 1.2 x 10⁸ 7.4 x 10⁸ 1.9 x 10⁹ 1.22 x 10¹⁰L. acidophilus 2.9 x 10⁸ 1.31 x 10⁹ 2.86 x 10⁹ 1.03 x 10¹⁰L. casei 3.3 x 10⁸ 7.5 x 10⁸ 1.62 x 10⁹ 4.64 x 1093.2. Biochemical components of fermented myrtle fruit pureeThe results of biochemical composition evaluation, including total phenolic content and total flavonoid content of the MFP before and after fermentation with Lactobacillus strains, are shown in Table 2 and Table 3, respectively. The results in Table 2 show that after fermentation, the total phenolic content of the
