


Page 86 - ISC PROCEEDINGS 21.4
P. 86
10.12). This result indicates that, although the model has been improved, autocorrelation
                  remains; therefore, the authors continue to remove variables with high autocorrelation to
                  enhance the stability and reliability of the regression estimates.
                        * The time-series regression model produces the following results: The linear
                  regression results of the model with the dependent variable SD and the independent
                  variables DE, CKH, CCN, LD are presented in the table, showing that the model has high
                  explanatory power. The R² value = 0.9928 and the adjusted R² = 0.9839 indicate that
                  approximately 99.3% of the variation in the Sustainable Development Index (SD) is
                  explained by the independent variables in the model.
                                                Table 4: Regression model results
                        SD               Coef.             Std. Err. t           t             P>t
                        DE             0.970931            0.262694             3.7           0.006
                       CKH             0.0000506           1.91E-05            2.65           0.046
                       CCN             -0.010707            0.02638            -0.41          0.706
                        LD             -0.758742           0.209582            -3.62          0.022
                      _cons            -0.698375           3.230999            -0.22          0.839
                                                                                            Source: Author
                        * Tests for model issues, including multicollinearity, heteroskedasticity, and
                  autocorrelation, yield the following findings:
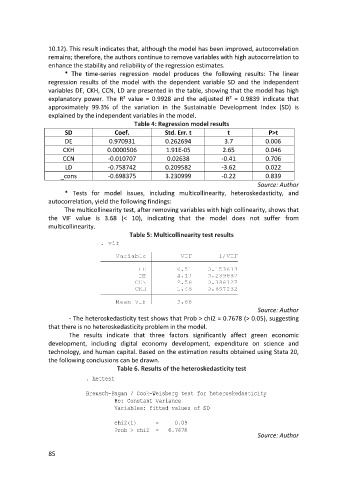
                        The multicollinearity test, after removing variables with high collinearity, shows that
                  the VIF value is 3.68 (< 10), indicating that the model does not suffer from
                  multicollinearity.
                                               Table 5: Multicollinearity test results


                                                                                            Source: Author
                         - The heteroskedasticity test shows that Prob > chi2 = 0.7678 (> 0.05), suggesting
                  that there is no heteroskedasticity problem in the model.
                         The results indicate that three factors significantly affect green economic
                  development, including digital economy development, expenditure on science and
                  technology, and human capital. Based on the estimation results obtained using Stata 20,
                  the following conclusions can be drawn.
                                          Table 6. Results of the heteroskedasticity test


                                                                                            Source: Author


                  85

