


Page 85 - ISC PROCEEDINGS 21.4
P. 85
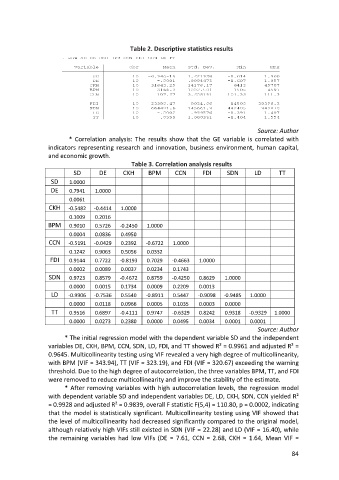
Table 2. Descriptive statistics results


                                                                                            Source: Author
                         * Correlation analysis: The results show that the GE variable is correlated with
                  indicators representing research and innovation, business environment, human capital,
                  and economic growth.
                                               Table 3. Correlation analysis results
                           SD       DE      CKH      BPM      CCN       FDI      SDN      LD       TT
                   SD    1.0000
                   DE    0.7941   1.0000
                         0.0061
                  CKH    -0.5482  -0.4414  1.0000

                         0.1009   0.2016
                  BPM    0.9010   0.5726   -0.2450   1.0000
                         0.0004   0.0836   0.4950
                  CCN    -0.5191  -0.0429  0.2392   -0.6722   1.0000
                         0.1242   0.9063   0.5056    0.0332
                   FDI   0.9144   0.7722   -0.8193   0.7029  -0.4663   1.0000
                         0.0002   0.0089   0.0037    0.0234   0.1743
                  SDN    0.9723   0.8579   -0.4672   0.8759  -0.4250   0.8629   1.0000
                         0.0000   0.0015   0.1734    0.0009   0.2209   0.0013
                   LD    -0.9906  -0.7536  0.5540   -0.8911   0.5447   -0.9098  -0.9485  1.0000
                         0.0000   0.0118   0.0966    0.0005   0.1035   0.0003   0.0000
                   TT    0.9516   0.6897   -0.4111   0.9747  -0.6329   0.8242   0.9318   -0.9329  1.0000

                         0.0000   0.0273   0.2380    0.0000   0.0495   0.0034   0.0001   0.0001
                                                                                            Source: Author
                        * The initial regression model with the dependent variable SD and the independent
                  variables DE, CKH, BPM, CCN, SDN, LD, FDI, and TT showed R² = 0.9961 and adjusted R² =
                  0.9645. Multicollinearity testing using VIF revealed a very high degree of multicollinearity,
                  with BPM (VIF = 343.94), TT (VIF = 323.19), and FDI (VIF = 320.67) exceeding the warning
                  threshold. Due to the high degree of autocorrelation, the three variables BPM, TT, and FDI
                  were removed to reduce multicollinearity and improve the stability of the estimate.
                        * After removing variables with high autocorrelation levels, the regression model
                  with dependent variable SD and independent variables DE, LD, CKH, SDN, CCN yielded R²
                  = 0.9928 and adjusted R² = 0.9839, overall F statistic F(5,4) = 110.80, p = 0.0002, indicating
                  that the model is statistically significant. Multicollinearity testing using VIF showed that
                  the level of multicollinearity had decreased significantly compared to the original model,
                  although relatively high VIFs still existed in SDN (VIF = 22.28) and LD (VIF = 16.40), while
                  the remaining variables had low VIFs (DE = 7.61, CCN = 2.68, CKH = 1.64, Mean VIF =

                                                                                                       84

